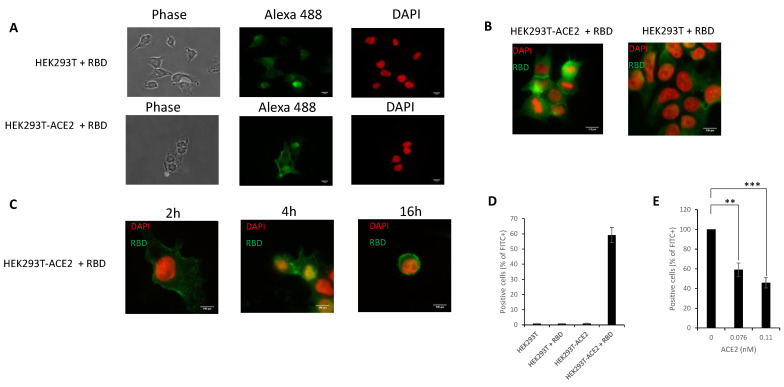
Figure 7.
Cell monitoring and quantification of the S-RBD/ACE2 interaction. The SARS-CoV-2 S-RBD fragment was added to either HEK293T or HEK293-ACE2 cells for 16 h and immunofluorescence has been performed using anti-(His)6 antibody and secondary antibody coupled to Alexa-Fluo 488. Cells were observed by epifluorescence microscopy (A). A typical DAPI/Alexa 488 channels merge is reported in (B) and RBD distribution profile in HEK293T-ACE2 cells over time is reported in (C). Cells were also analyzed using flow cytometry to detect the percentage of cells positive for FITC signal in the absence (D) or in the presence of increasing concentration of ACE2 soluble protein (E). ** p < 0.05; *** p < 0.001.

