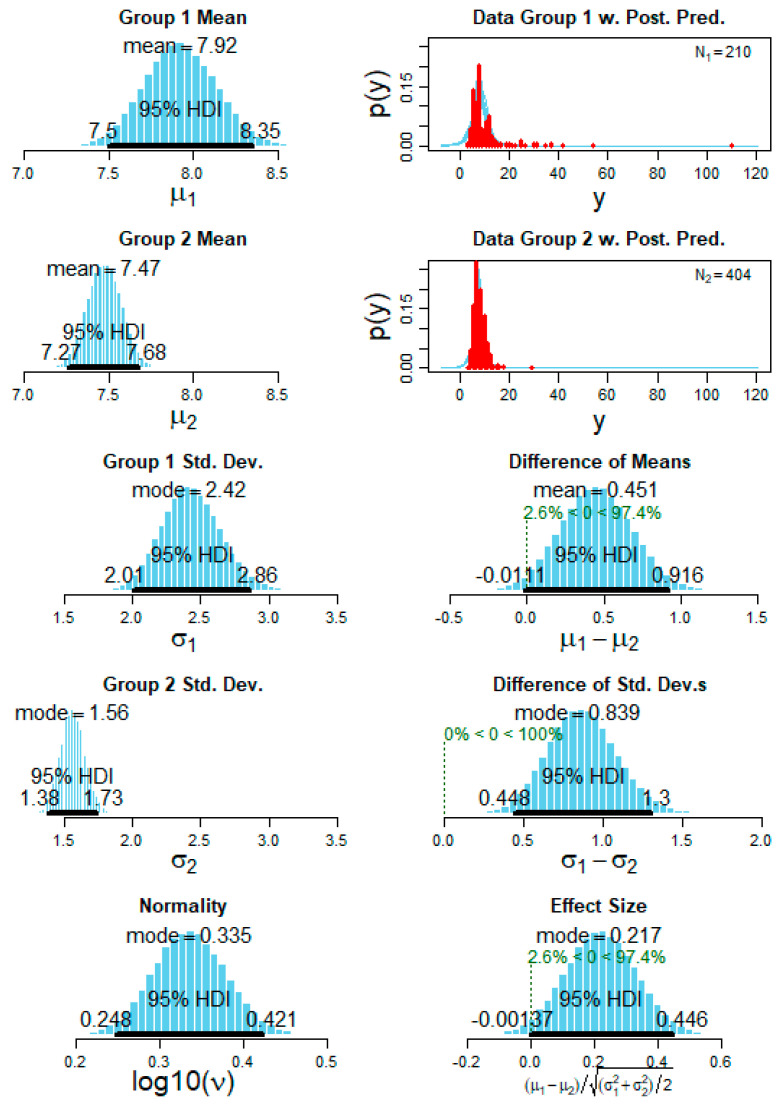
Figure 10.
A representative example of the Bayesian statistics of the posterior predictive distribution (PPD) for the variable arousal amplitude. The first column (top to bottom) shows the subject 1 mean PPD, subject 2 mean PPD followed by standard deviation of each subject and finally the normality PPD for the datasets. The second column (top to bottom) shows the subject 1 raw values distribution with the interpolated kernel (N1 = 210 arousals for subject 1) and the subject 2 raw values distribution (N2 = 402 arousals for subject 1) followed by the difference of the means and standard deviation and finally checking the effect size for the comparison of the two subjects’ data. The difference of means shows a clear distinction of (100%) between the two subjects and also the standard deviation showed a clear distinction with (100%). For all the PPD graphs, the 95% highest density interval (HDI) is shown as dark black lines.

