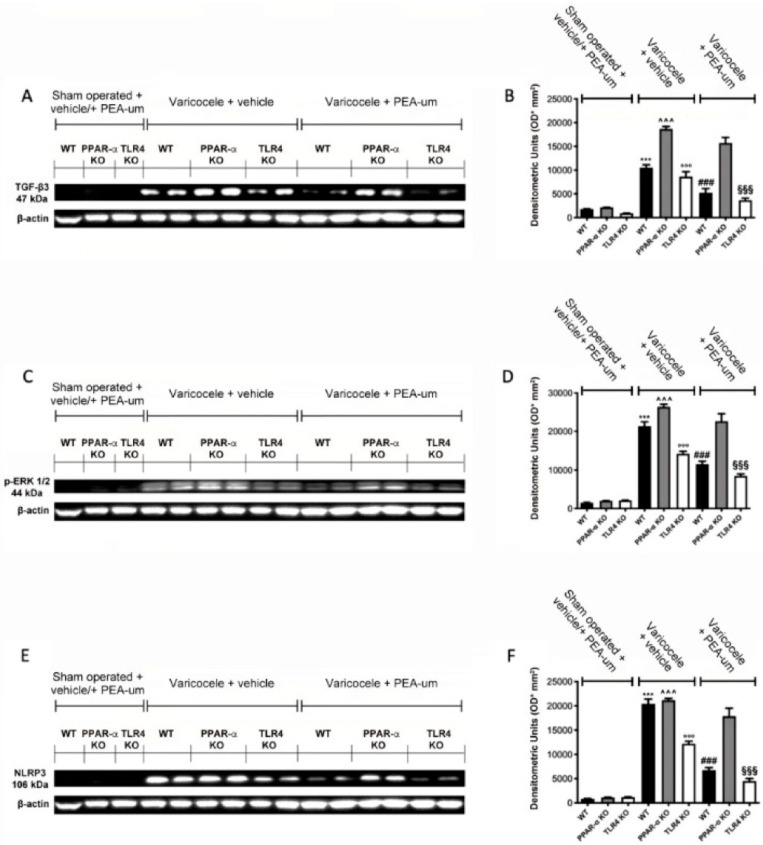
Figure 6.
Effects of the absence of PPAR-α and TLR4 on transforming growth factor-beta3 (TGF-β3), p-ERK 1/2, NLRP3 expression. Western blot analysis of TGF-β3 (A,B), p-ERK 1/2 (C,D), NLRP3 (E,F). *** p < 0.001 vs. sham WT, °°° p < 0.001 vs. sham TLR4, ˆˆˆ p < 0.001 vs. sham PPAR-α, §§§ p < 0.001 vs. vehicle TLR4, ### p < 0.001 vs. vehicle WT. *** p < 0.001 vs. sham WT, °°° p < 0.001 vs. sham TLR4, ˆˆˆ p < 0.001 vs. sham PPAR-α, §§§ p < 0.001 vs. vehicle TLR4, ### p < 0.001 vs. vehicle WT.

