
Fig. 3.
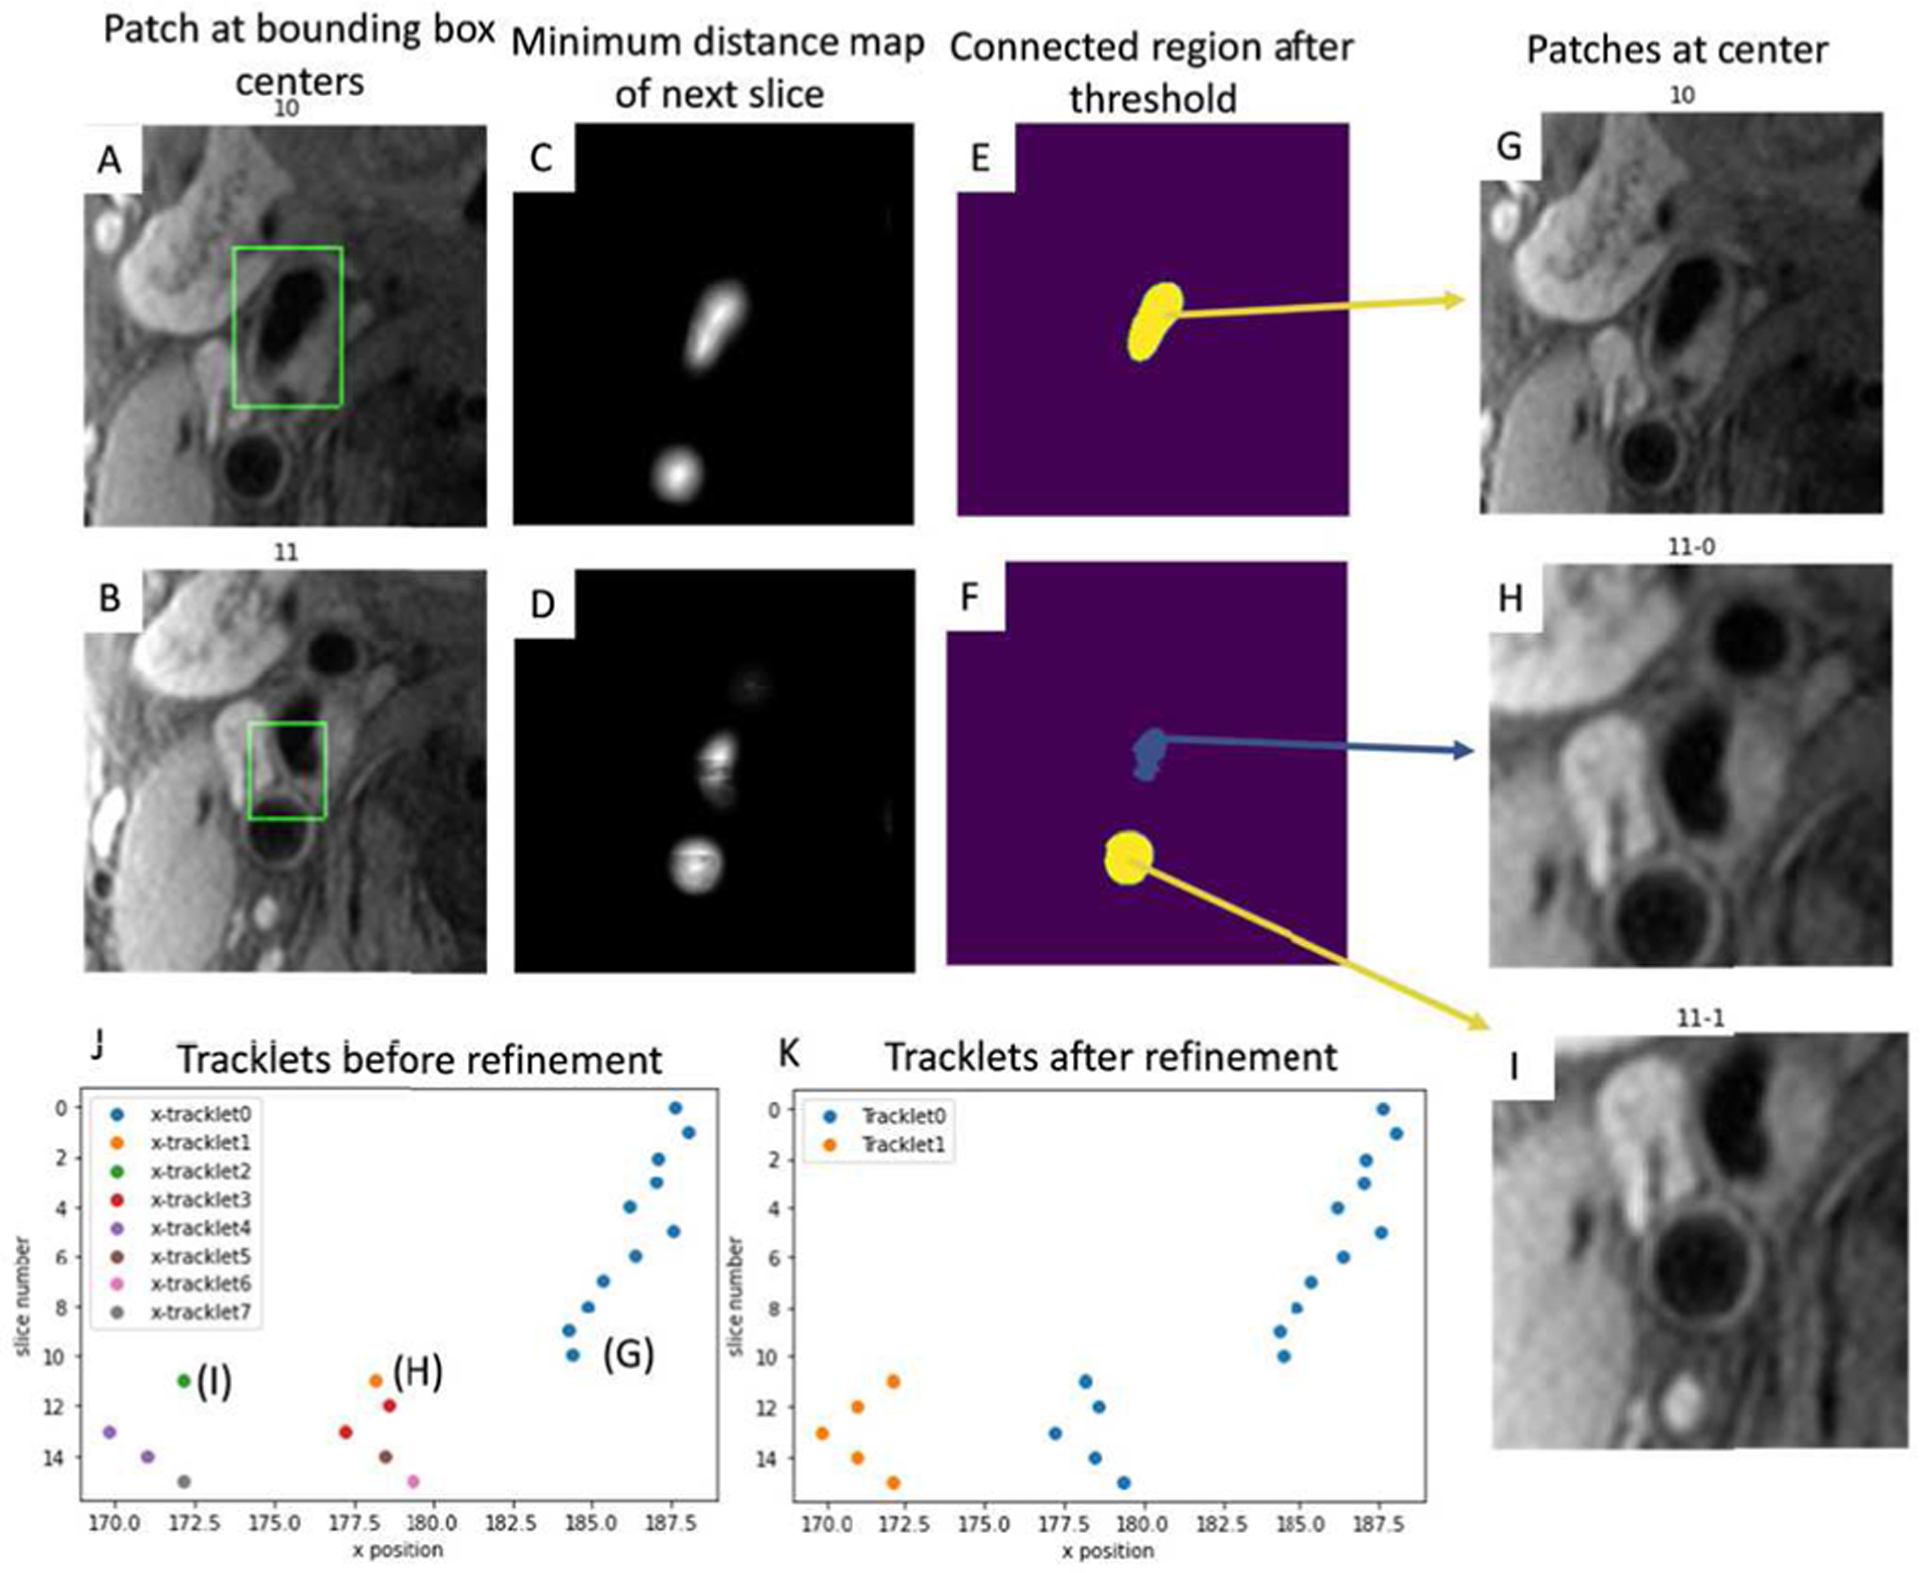
A, B: Bounding boxes detected by Yolo V2 at slices 10 and 11 to identify rough artery locations. C, D: Minimum distance map predictions. E, F: Connected regions showing overlap with bounding boxes after threshold of C and D. G: Patch from the connected region center (as lumen centers) of E. H, I: Patches from two connected region centers from F. J: Lumen centers of all slices form tracklets (x position vs z position). K: Tracklets after refinement. The longest tracklet (blue) on each side of the carotid artery is used as the centerline for segmentation.