
Fig. 5.
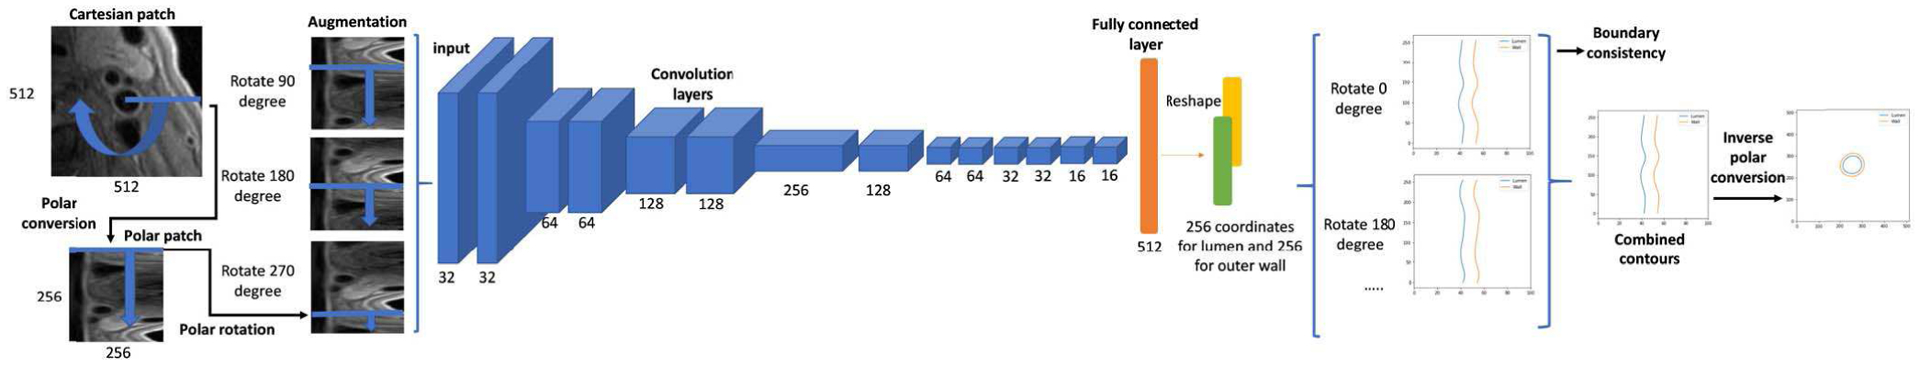
CNN architecture for polar regression. Number of kernels are shown in each convolution layer. Each convolution layer was followed by a batch normalization layer and a rectified linear unit. The depth channel is not drawn for simplicity. Each rotated polar patch regresses boundary coordinates in t = 256 directions. The predicted coordinates from different angles were averaged for smoothness, and their standard deviation was used to estimate boundary consistency, as the segmentation confidence score. Finally, the polar boundary coordinates were converted back to the Cartesian coordinate system and the regions between lumen and outer wall contours were used as the segmentation result.