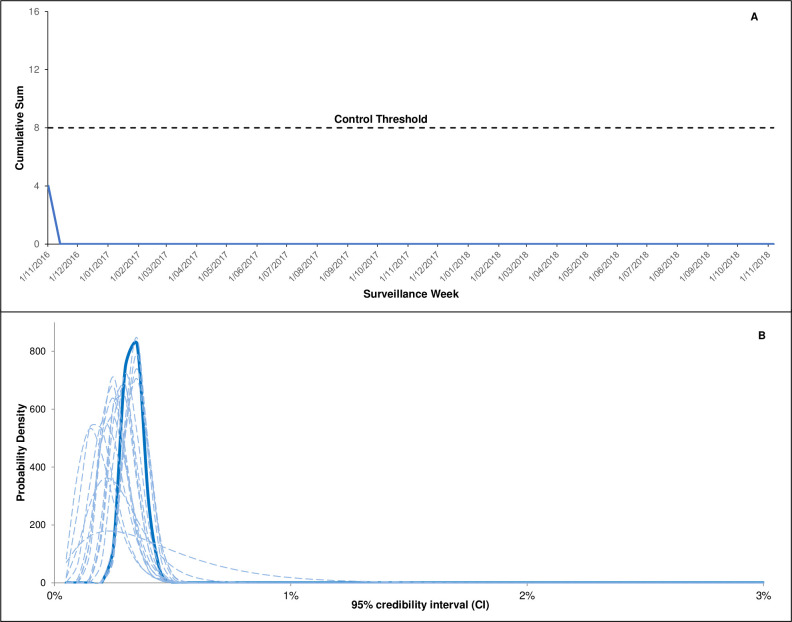
Figure 2.
Cumulative signal detection analyses and cumulative event rates following live attenuated herpes zoster vaccine for respondents using the SmartVax platform (regardless of timeliness of response). (A) Fast initial response cumulative sum (FIR CUSUM) safety signal detection chart for medical attendance following live attenuated herpes zoster vaccine during the surveillance period (FIR CUSUM tracks the relative log-likelihood ratio of the event rate being at the maximum acceptable rate (set at 3%) vs expected rate (set at 2%) given the accumulated data). (B) Overlayed bimonthly Bayesian analyses showing the probability density curve of medical attendance (dotted lines indicate bimonthly posterior density curves throughout the surveillance period; Solid line is the final posterior density curve). FIR CUSUM, fast initial response cumulative summation.

