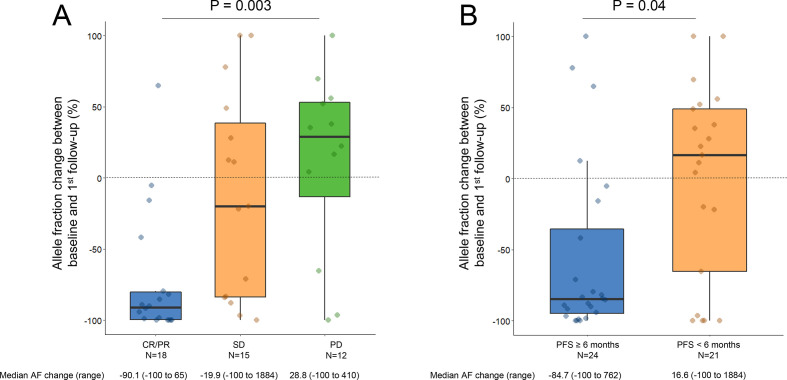
Figure 3.
(A) Plasma ctDNA change at the first follow-up blood sampling according to the response to pembrolizumab±chemotherapy. (B) Plasma ctDNA change at the first follow-up according to whether the progression-free survival (PFS) was ≥6 months or <6 months to pembrolizumab±chemotherapy. Y-axis is truncated at 100%. AF, allele fraction; ctDNA, circulating tumor DNA.

