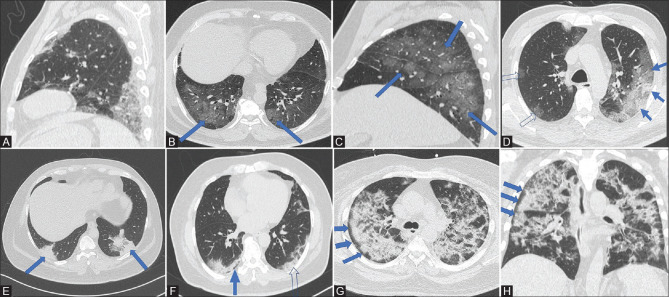
Figure 1 (A-H).
(A) CT chest (sagittal) shows mixed GGO and consolidation in the lower lobe in the posterior aspect with pleural contact. (B and C) axial and sagittal images of the same patient showing pure GGOs (solid blue arrows) in a posterior and peripheral distribution. (D) CT chest (axial) shows mixed consolidation and GGO (solid blue arrows) on the left side located peripherally while foci of pure GGOs are seen on the right side (open arrows). (E) CT chest (axial) shows pure consolidations (solid blue arrows) in both the lungs seen posteriorly, peripherally with pleural contact. (F) CT chest (axial) shows well-defined margins of subpleural consolidations on the left side with pleural contact (open arrow). On the right, the consolidations show subpleural sparing (solid blue arrow). (G and H): Axial and coronal images show bilateral patchy consolidations in a patient with subpleural sparing more pronounced on the right side (solid blue arrows)

