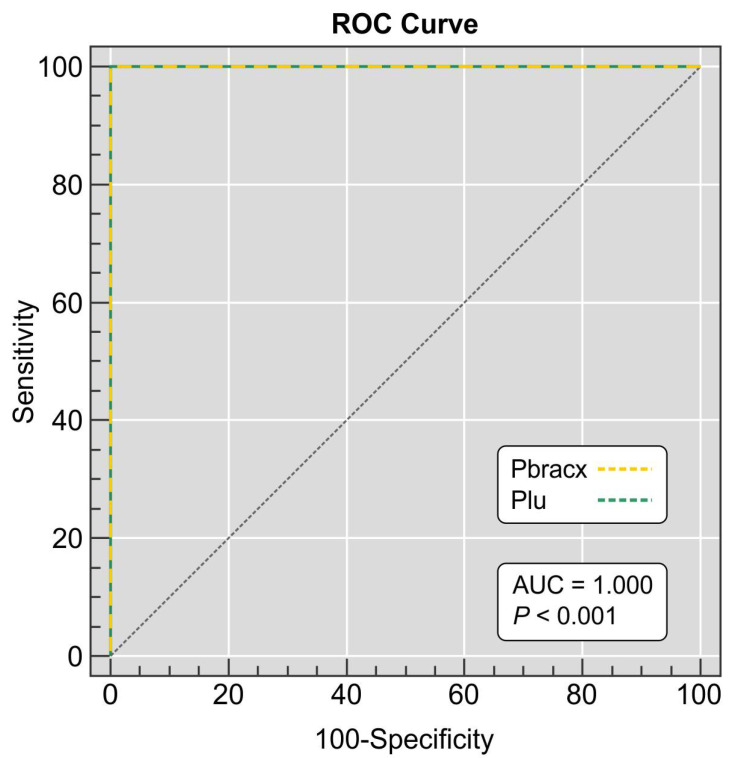
Figure 3.
Receiver operating characteristics (ROCs) depicting duplex PCR assay sensitivity and specificity. Samples were from 49 P. brasiliensis complex isolates, 13 P. lutzii isolates, and 68 non-target fungal DNA derived from agents of superficial, subcutaneous, and systemic mycoses in humans and animals. The ROC is plotted between the true-positive rate (sensitivity) on the y-axis and the false-positive rate (100-specificity) on the x-axis. The area under the curve (AUC) represents the accuracy of the duplex assay, which was 1.000 (95% CI 0.972–1.000, p < 0.0001).

