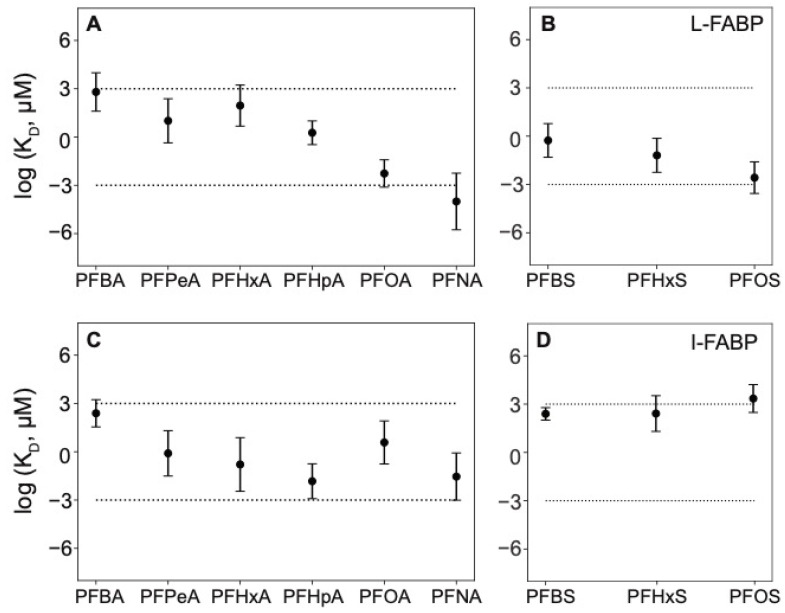
Figure 3.
Predicted dissociation constant (KD) values (geometric mean ± 1 standard error) for (A) liver fatty acid binding proteins (L-FABP) and PFCAs, (B) L-FABP and PFSAs, (C) intestinal fatty acid binding proteins (I-FABP) and PFCAs, and (D) I-FABP and PFSAs. Values of log KD > 3 correspond to millimolar or weaker binding, between −3 and 3 are moderate (in the micromolar range) and <−3 correspond to strong, nanomolar or lower binding.

