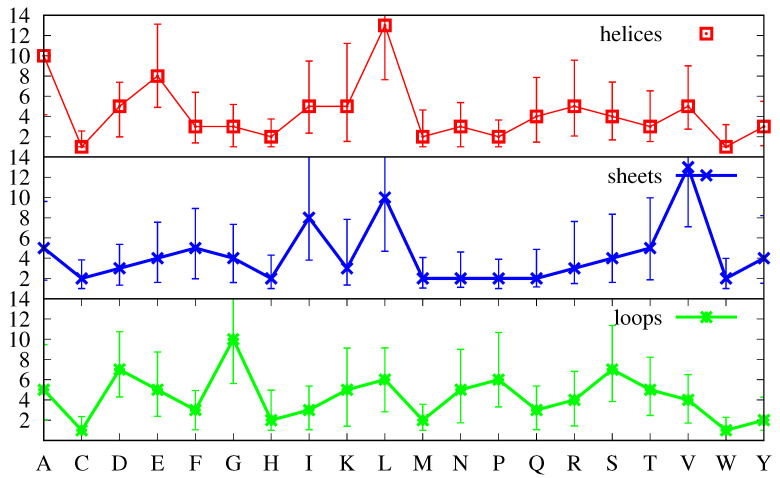
Figure 3.
Average frequency of finding an amino acid a in -helices (top plot), -strands (middle plot) and loops (bottom plot). The values are given in percentage for each secondary structure, i.e., summing all the values in each line leads to 100. The amino acids are specified by their one letter codes.

