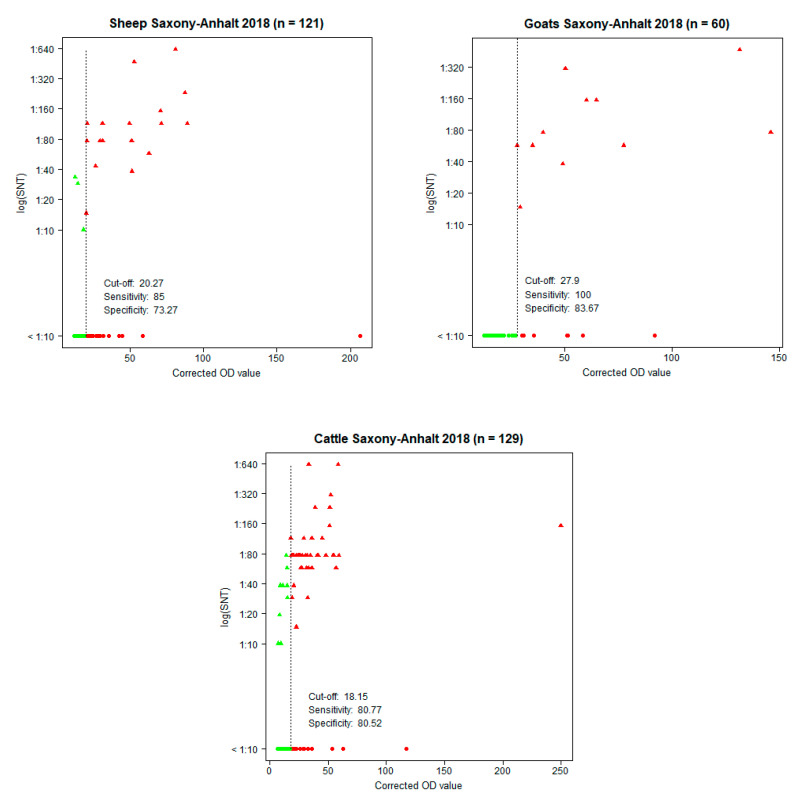
Figure 1.
Corrected optical density (OD) values of the ELISA in relation to the neutralization titers (log (SNT)) of the SNT showing the cut-off, sensitivity, and specificity for each species. Green dots: SNT- and ELISA-negative samples. Green triangles: SNT-positive, but ELISA-negative samples. Red triangles: SNT- and ELISA-positive samples. Red dots: SNT-negative, but ELISA-positive samples.

