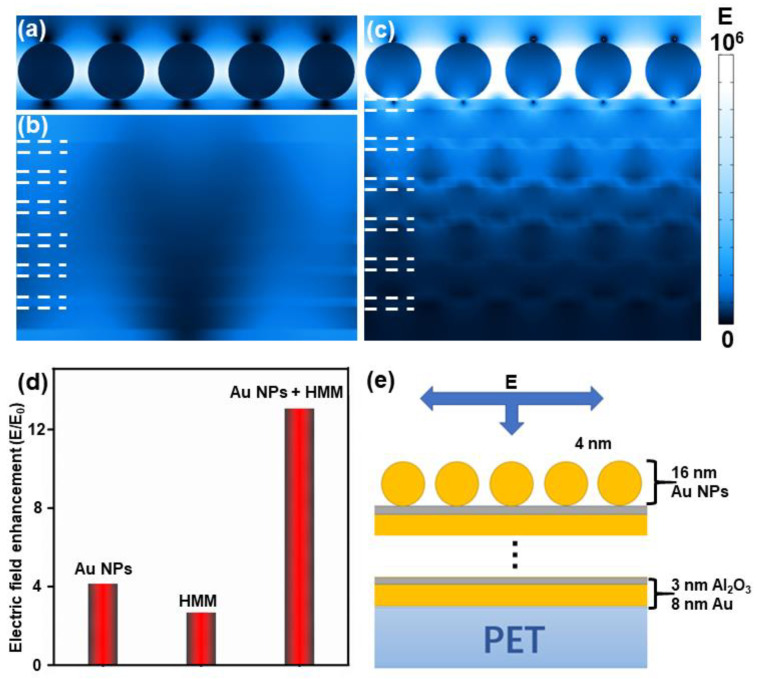
Figure 3.
The simulation of y–z views of electric field distributions for (a) single Au-NP layer, (b) the hyperbolic metamaterial (HMM) consisting of six bilayers with 8 nm Au and 3 nm Al2O3, and (c) the combination of the Au-NP layer and HMM. (d) A histogram drawing a comparison of the electric field enhancement (E/E0) among the Au NPs, HMM and Au NPs + HMM composite structure. (e) The simulation setup of the composite structure substrate.

