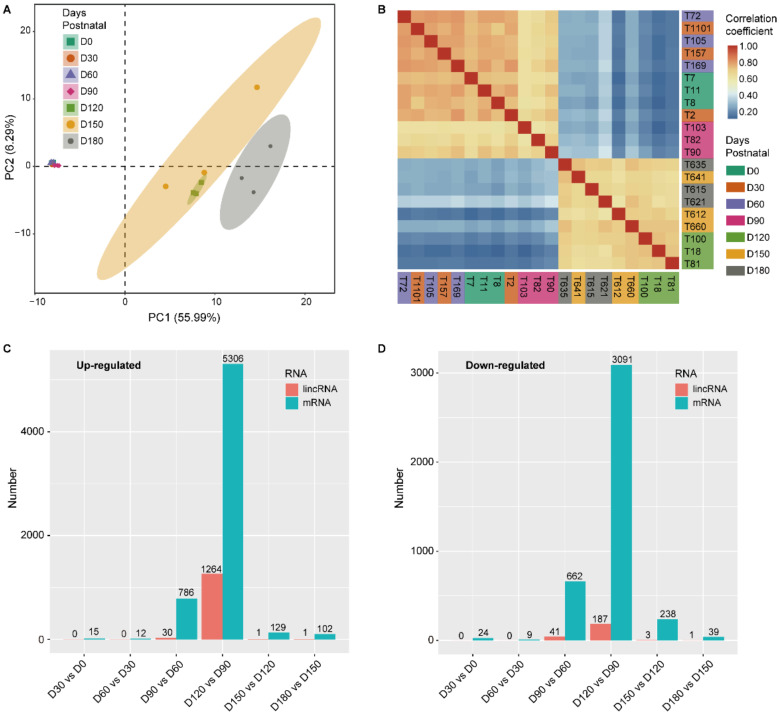
Figure 2.
The discrete expression patterns of lincRNAs and mRNAs. (A) Principal component analysis (PCA) of 21-pair distinct samples across the seven ages based on normalized lincRNA expression levels. The samples were clustered by age. (B) Heatmap of correlation coefficient for 21 samples based on the lincRNA expression level. The samples were grouped by hierarchical clustering and the dendrogram was not shown. The color of the blocks below the sample names represents the age group to which each of the samples belonged. (C,D) Number of differentially expressed lincRNAs and mRNAs between neighboring age groups.

