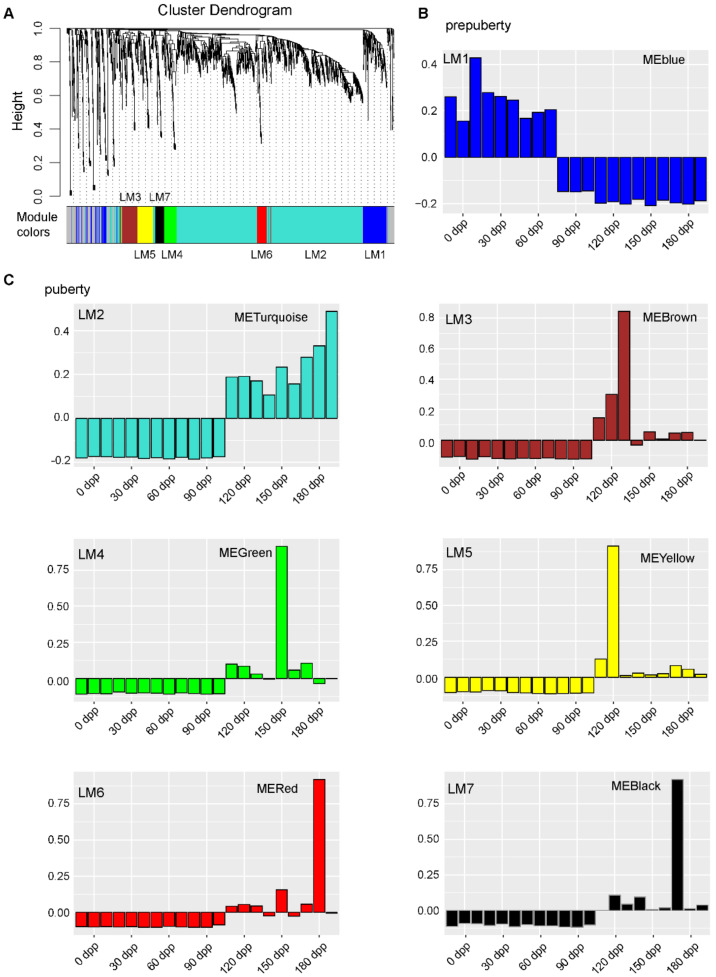
Figure 3.
LincRNAs are clustered into temporal-specific modules by the weighted gene co-expression network analysis. (A) Hierarchical cluster dendrogram of all lincRNAs modules. Modules corresponding to branches are labeled with colors indicated by the color bands underneath the tree. (B,C) Eigengene bar plot of lincRNA modules. Samples were sorted by days postnatal in the order of 0, 30, 60, 90, 120, 150, and 180 DP. LM represents lincRNA module.

