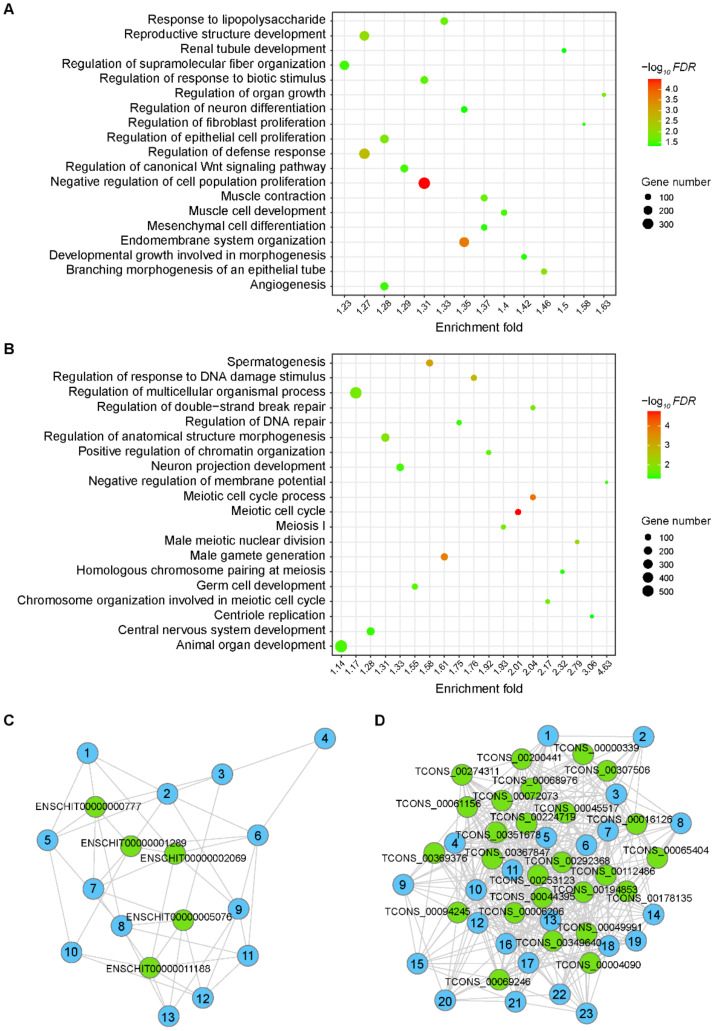
Figure 4.
The function of lincRNA in key modules associated with testicular development. (A,B) Bubble chart presentation of the gene ontology (GO) terms for lincRNAs in modules LM1 (A) and LM2 (B). The function of each lincRNA was annotated by coexpressed mRNAs. The color degree of each dot represents the statistical significance of pathways (−log10FDR). The size of the dot represents the number of mRNAs. (C,D) The R package ‘igraph’ generated network-based visualization demonstrates the hub lincRNAs of module LM1 (A) and LM2 (B). The green dots represent the hub lincRNAs. The blue dots represent lincRNAs whose Ki value were slightly lower than hub lincRNAs and details were shown in Table S9.

