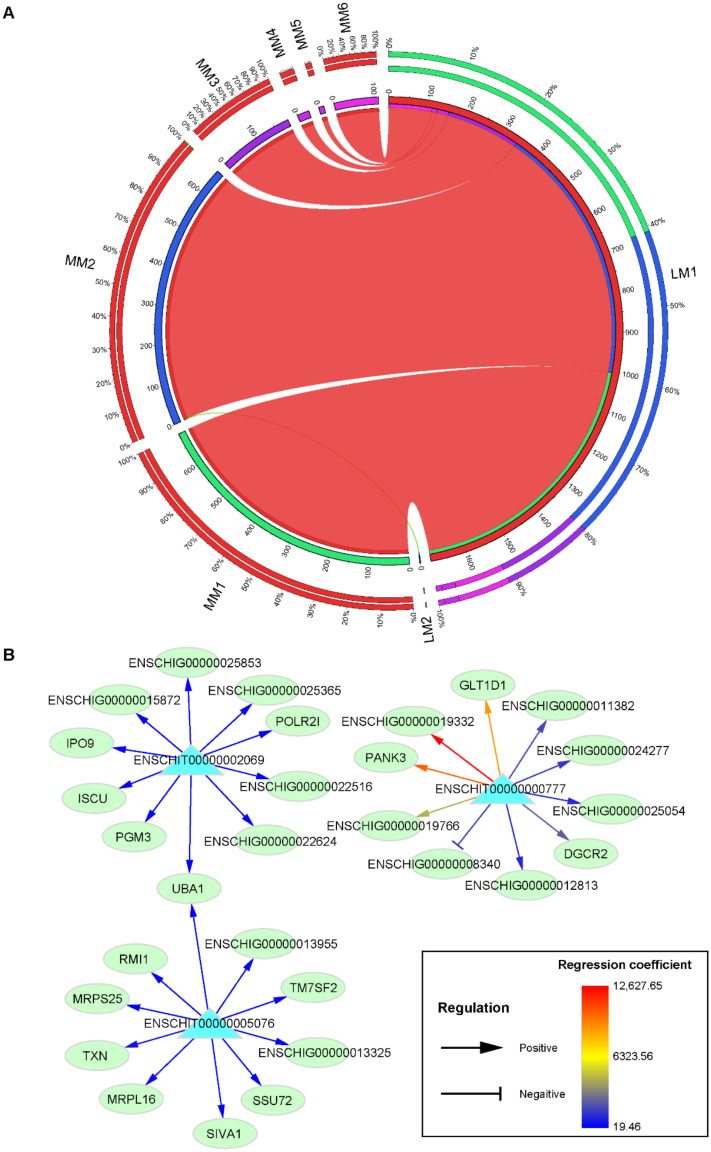
Figure 5.
The prediction of the regulatory relationship between lincRNAs and mRNAs. (A) Circular presentation of the positive association between lincRNA and mRNA modules. The length of the inside cambered bar represents the number of lincRNAs and mRNAs. The outer cambered bar represents the proportion of lincRNAs and mRNAs with potential regulatory relationships to the number of total lincRNAs (LM modules) and mRNAs (MM modules) in the module to which they belonged. (B) The predicted regulatory relationship between hub lincRNAs of module LM1 (blue triangles) and mRNAs (green ellipses). The absolute regression coefficients were ranked and the top ten mRNAs with higher regression coefficients were selected for illustration. The arrow indicates the positive regulatory relationships and the T-shaped head indicates the negative regulatory relationships.

