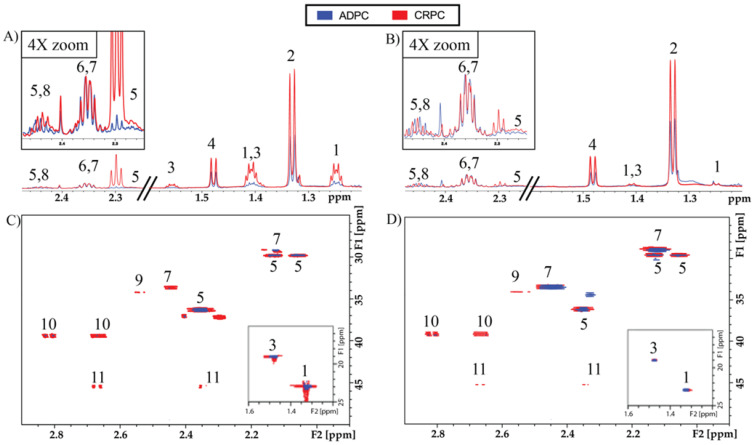
Figure 1.
High-resolution NMR spectra of tumor extracts. Representative 1D 1H spectra with water presaturation of ADPC (blue) and CRPC (red) TRAMP tumors labeled with (A) [U-13C]glucose, and (B) [U-13C]glutamine. Zoomed region indicates glutamate C4 region with vertical scale increased by 4-fold. High resolution 2D 1H-13C HSQC of ADPC and CRPC TRAMP tumors labeled with (C) [U-13C]glucose, and (D) [U-13C]glutamine. Metabolite peaks are labeled as follows: (1) 13C-Lactate, (2) Lactate, (3) 13C-Alanine, (4) Alanine, (5) 13C-Glutamate, (6) Glutamate, (7) 13C-Glutamine, (8) Glutamine, (9) 13C-Glutathione, (10) 13C-Aspartate, (11) 13C-Malate.

