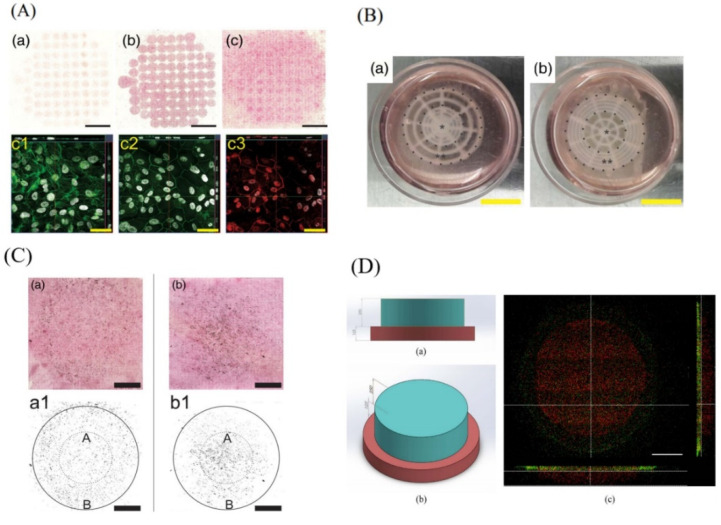
Figure 8.
(A) Bio-printed ARPE-19 cells (a–c): hematoxylin and eosin staining at days 1, 7, and 14, respectively, scale bar: 5 mm. Confocal images of ARPE-19 cell layers at Day 14: F-actin cytoskeleton immunofluorescence staining (c1), Zonula occludens-1 (c2) in green, Claudin-1 (c3) in red, and nuclei in grey, scale bar: 50 μm. Reproduced with permission form [75], Wiley, 2018. (B) The bio-printed retinal equivalents with two distinctive Y79 cell-seeding density: high average cell density at the center (a) and high average cell density at the periphery (b); *: central area, **: periphery; scale bar: 10 mm. Reproduced with permission from [24], Whioce Publishing Pte. Ltd., 2017. (C) Hematoxylin and eosin staining of the bio-printed Y79 cells with two distinctive patterns on ARPE-19 cell monolayer at Day 14: high density at periphery (a) and high density at the central area (b). Data analysis (integrated intensity) of bio-printed Y79 proliferation after 14 days, high density at periphery (a1), and high density at the central area (b1); A = area of the inner circle; B = area of the annulus; diameters: small circle (10 mm) and large circle (20 mm); scale bar: 5 mm. Reproduced with permission from [75], Wiley, 2018. (D) Bilayer printing of fluorescent labelled hydrogels: (a) Top view and (b) side view of structural design from SolidWorks® (c) Confocal fluorescent images showing bilayer construct. The printed structure recapitulated the structural design, indicating ability to construct multi-layered structure. Scale bar = 500 µm. Reproduced with permission from [76], Elsevier, 2018.

