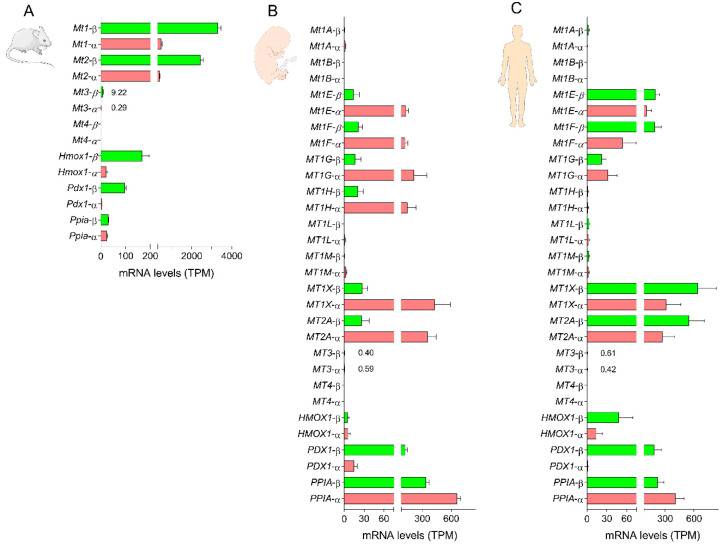
Figure 2.
Pattern of metallothionein gene expression in pancreatic beta and alpha cells. (A) Changes in the mRNA levels of Mt1-4, Hmox1, Pdx1 and Ppia in purified mouse beta and alpha cell preparations. Data are the means of the average number of transcripts per million (TPM) ± SEM for 5 (beta) and 3 (alpha) preparations. RNA sequencing data were obtained from the Gene Expression Omnibus database under the accession number GSE80673 [77]. (B) Changes in the mRNA levels of MT1A, MT1B, MT1E, MT1F, MT1G, MT1M, MT1X, MT2A, MT3, MT4, HMOX1, PDX1 and PPIA in purified human fetal beta and alpha cell preparations. (C) Changes in the mRNA levels of MT1A, MT1B, MT1E, MT1F, MT1G, MT1M, MT1X, MT2A, MT3, MT4, HMOX1, PDX1 and PPIA in purified human adult beta and alpha cell preparations. Data are the means of the average number of TPM ± SEM for 5 (fetal alpha), 6 (adult alpha and fetal beta) and 7 (adult beta) preparations. RNA sequencing data were obtained from the Gene Expression Omnibus database under the accession number GSE67543 [78].

