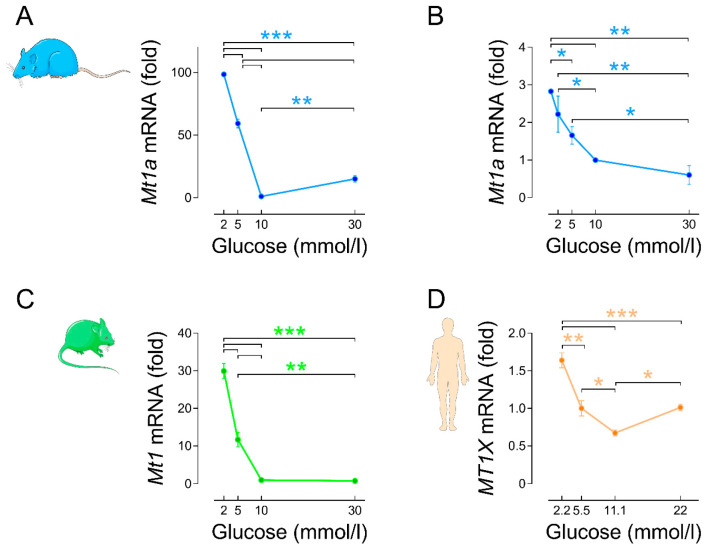
Figure 3.
Mt1a, Mt1 and MT1X mRNA levels are downregulated by glucose stimulation. (A) Changes in the mRNA levels of Mt1a in rat islets cultured for 18 h in the presence of increasing glucose concentrations (G2, G5, G10, G30). Islet isolation and culture, RNA extraction and RT-real time PCR were performed as previously described [87]. The primers used for Mt1a and the housekeeping gene Tbp are the same as in [87]. Data are means ± SEM of n = 4 experiments. (B) Changes in the mRNA levels of Mt1a in the rat beta-cell line INS 832/13 cultured for 24 h in the presence of increasing glucose concentrations (G0.5, G2, G5, G10, G30). INS 832/13 cells were kindly provided by Dr. Christopher Newgard, Duke University. Cell culture, RNA extraction and real-time PCR were performed as previously described [91]. Data are means ± SEM of n = 3 experiments. (C) Changes in the mRNA levels of Mt1 in mouse islets cultured for 24 h in the presence of increasing glucose concentrations (G2, G5, G10, G30). Data were taken from [6] with permission of the publisher. Data are means ± SEM of n = 4 experiments. (D) Changes in the mRNA levels of MT1X in human islets from non-diabetic donors cultured for 24 h in the presence of increasing glucose concentrations (G2.2, G5.5, G11.1, G22). Data were taken from [6] with permission of the publisher. Data are means ± SEM of n = 3 experiments. * p < 0.05, ** p < 0.01, *** p < 0.001 for the indicated comparisons; one-way ANOVA with Newman–Keuls post hoc test.

