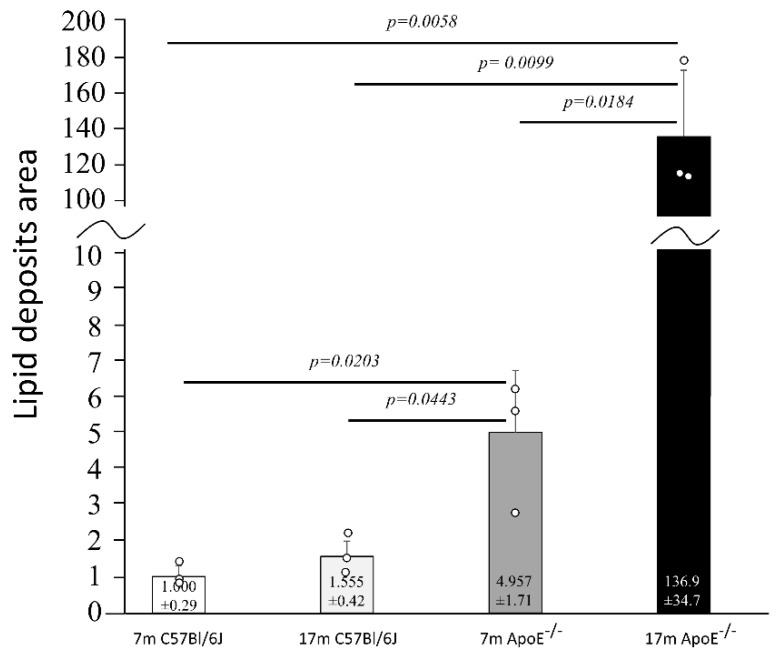
Figure 2.
Senescence-related increase of the area of lipid deposits in liver cells. The relative area of lipid droplets in liver tissue of C57Bl/6J and ApoE−/− mice is shown in relation to corresponding controls (7 months old). The actual area of lipid deposits in ApoE−/− mice was larger than in C57Bl/6J mice; shown is the average number of pixels (pxs) attributed to lipid deposits normalized to a mean of 7m C57Bl/6J for visualization purposes. Data were analyzed by a two-way ANOVA test (the exact F values for genotype and age are 48.16 and 43.57, respectively), followed by Dunn–Sidak’s multiple comparison post-hoc test. Shown are the means ± standard deviations. The significance of differences between compared groups are marked with obtained p-values (p) for each significant comparison; the different genotype groups were not littermates; row data are depicted by circles; m–months.

