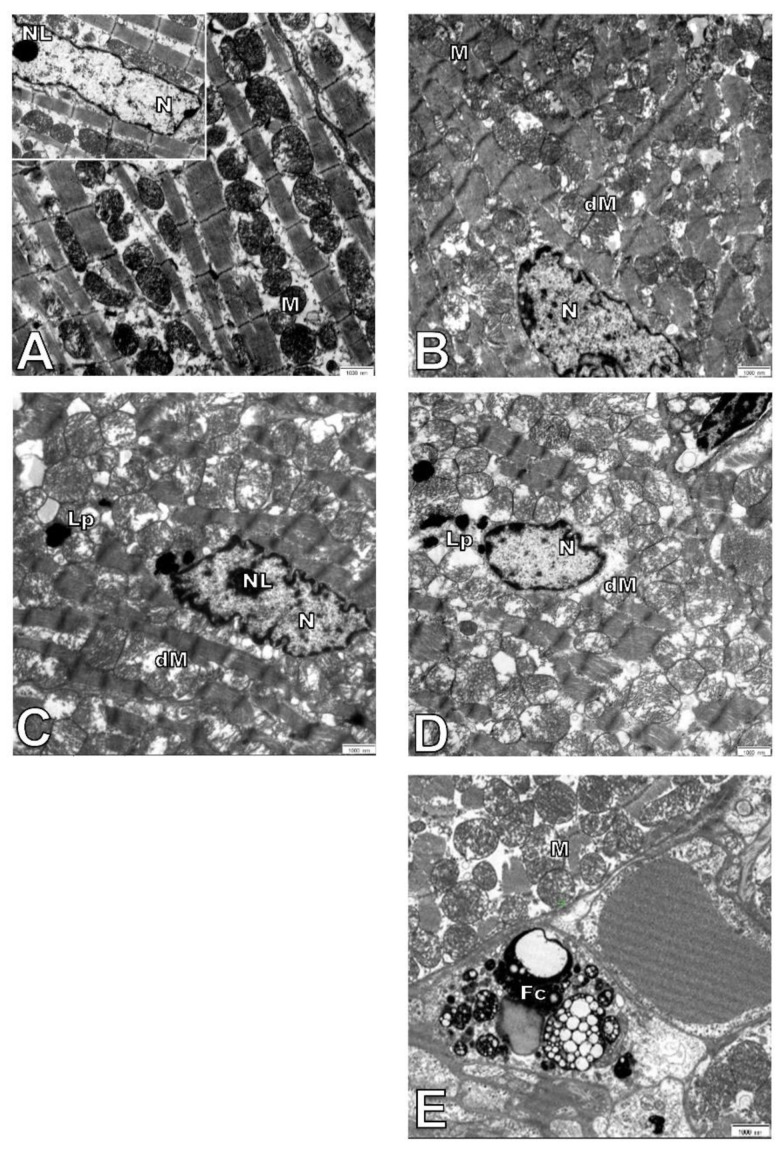
Figure 6.
Electron micrographs showing ultrastructure of cardiomyocytes. The figure shows representative pictures of C57Bl/6J (A) and ApoE−/− (B) 7-month-old mice and C57Bl/6J (C) and ApoE−/− (D,E) 17-month-old mice. Fc—foam cell, Lp—lipofuscin, M—mitochondria, dM—damage mitochondria, N—nucleus, NL—nucleolus. Scale bar = 1000 nm.

