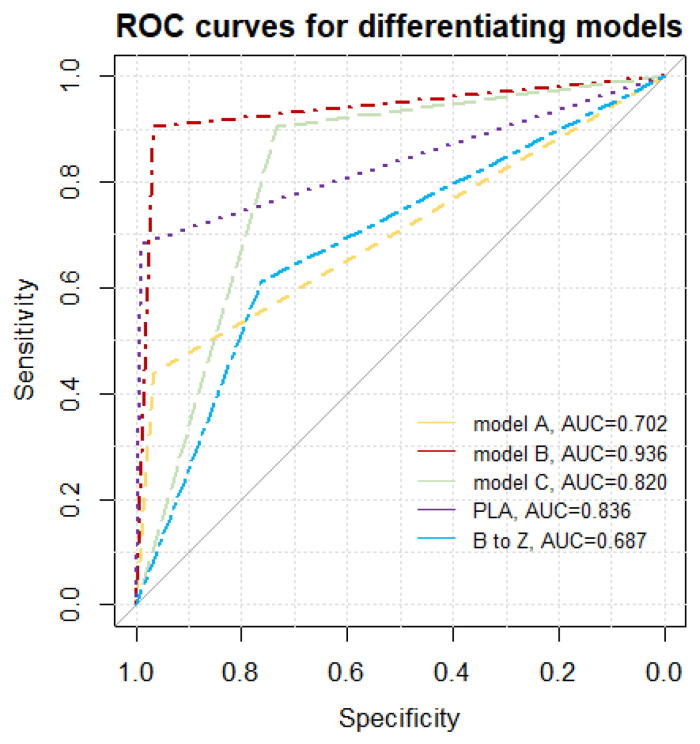
Figure 5.
Receiver operating characteristic (ROC) curves for methods of differentiation between pulmonary fibrosis and pulmonary edema. The area under the curve for model B is significantly greater than for other models, with maximal p-value of 0.0033 (model B compared to PLA); PLA—pleural line abnormalities in a single examination zone, B to Z—Conversion of B-line artifacts to Z-line (with the frequency changed from 2 MHz to 6 MHz) in a single examination zone; model A—any conversion of vertical artifacts (B to Z, B to A, Z to A with the frequency changed from 2 MHz to 6 MHz) in 3 or more areas, and lack of consolidations, model B—any conversion of vertical artifacts (B to Z, B to A, Z to A with the frequency changed from 2 MHz to 6 MHz) in 3 or more areas, lack of consolidations, and PLA in at least 2 zones, model C—any conversion of vertical artifacts (B to Z, B to A, Z to A with the frequency changed from 2 MHz to 6 MHz) in 3 or more areas, and PLA in at least 2 zones. AUC—area under the curve.

