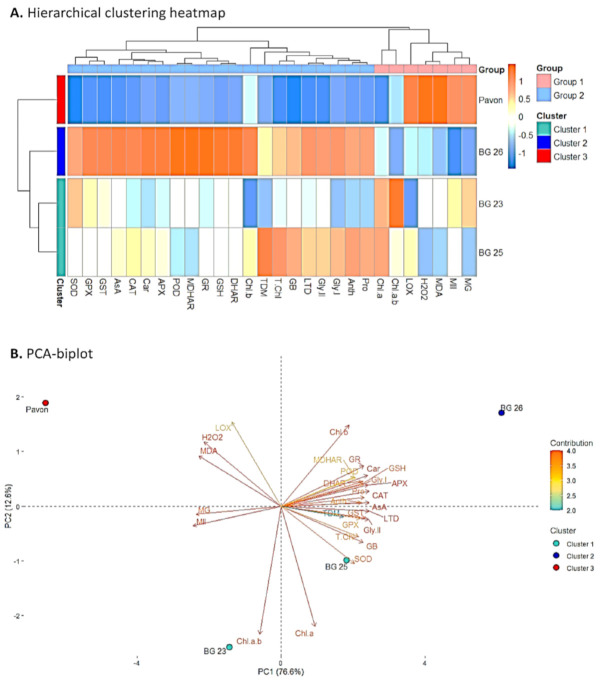
Figure 8.
Hierarchical clustering and PCA-Biplot indicates an association between treatments, variables and varieties. (A) Hierarchical clustering heatmap: The STI (Stress Tolerance Index) mean values obtained from the studied variables of all varieties, which were then normalized and clustered. Two distinct groups were obtained at the variable levels (Group-1 and 2) (B) for all varieties. Different color scale expresses the intensity of the normalized mean values of various variables. PCA-Biplot: Varieties dispersed in different ordinates based on the dissimilarity among them. The length and color intensity of a vector in the biplot indicate the quality of representation and the contribution of the variable on the principal component, respectively. The angles between the vectors derived from the middle point of biplots exhibit positive or negative interactions among the variables. The variables included LTD, leaf temperature depression; MII, membrane injury index; MG, methylglyoxal; MDA, malondialdehyde; LOX, lipoxygenase; H2O2, hydrogen peroxide; Pro, proline; GB, glycine betaine; TDM, total dry matter; STI, stress tolerance index; GSH, glutathione; AsA, ascorbate; “Chl a”, chlorophyll a; “Chl b”, chlorophyll b; T.Chl, total chlorophyll; Chl.a.b, chlorophyll a/b; Car, carotenoids; Anth, anthocyanin; Gly.I, glyoxalase I; Gly.II, glyoxalase II; SOD, superoxide dismutase; CAT, catalase; POD, peroxidase; GPX, Glutathione peroxidase; GST, Glutathione S-transferases; GR, glutathione reductase; APX, ascorbate peroxidase; MDHAR, monodehydroascorbate reductase and DHAR, dehydroascorbate reductase.

