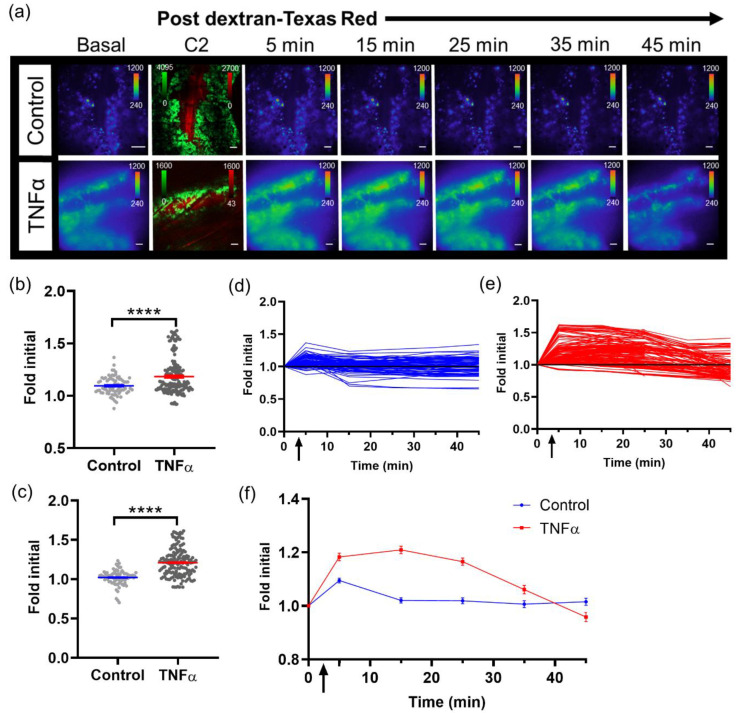
Figure 3.
Imaging single tumor cell signaling dynamics in vivo. (a) Representative in vivo microscopic images over time of NF- κB transcriptional activation by TNFα in B16F10 κB5-FLuc GFP reporter tumor cells in skin window chamber-bearing animals; 10X magnification; BLI, 10 min acquisition, open filter; Confocal imaging (C2), 4.8 speed, laser lines: 488 nm (GFP, tumor) and 561 nm (dextran-Texas Red, vasculature); scale bar represents 100 μm. BLI images showing NF- κB activation were obtained prior to and following dextran-Texas Red i.v. injection without (control, n = 3 animals) or with TNFα (n = 4 animals) at multiple time points (Basal, 5, 15, 25, 35, 45 min), while confocal image (C2) confirms presence of tumor cells (GFP, green) and successful i.v. administration of dextran-Texas Red (red). Quantification of changes in bioluminescence, indicative of changes in NF-κB transcriptional activation, following dextran alone or with TNFα administration at (b) 5 min and (c) 15 min (**** p < 0.0001). Quantification of bioluminescence changes over time in individual tumor cells in animals administered (d) dextran, or (e) dextran with TNFα. (f) Quantification of mean NF-κB transcriptional activation within tumor cells over time in vivo (data are represented as mean ± SEM); black arrow indicates when dextran alone or dextran with TNFα were administered.

