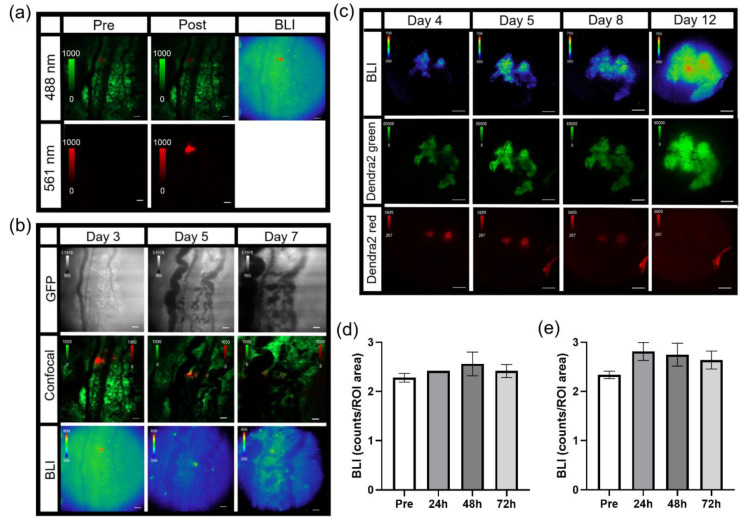
Figure 5.
Photoswitching B16F10 NF-κB-FLuc Dendra2 tumor cells and tumor areas. (a) Representative intravital confocal images (4.8 speed, laser lines: 488 nm (green unphotoconverted Dendra2) and 561 nm (red photoconverted Dendra2)) pre and post single cell photoconversion using the 405nm laser line and corresponding bioluminescence image (BLI, 20 min acquisition, open filter) at 10X; scale bar represents 100 μm. (b) Representative intravital microscopic image of B16F10 NF-κB-FLuc Dendra2 tumors over time following 405 nm confocal laser photoconversion of Dendra2 epifluorescence (GFP cube, 200 ms exposure), merged Dendra2 confocal image (green unphotoswitched and red photoswitched Dendra2) and NF-κB-FLuc bioluminescence image at 10X. (c) Representative intravital image of B16F10 NF-κB-FLuc Dendra2 tumors over time following photomarking larger tumor areas at 2X of NF-κB-FLuc bioluminescence (BLI), green unphotomarked Dendra2 (Dendra2 green, GFP cube, 2 s exposure), and red photomarked Dendra2 (Dendra2 red, DsRed cube, 5 s exposure). Quantification of NF-κB-FLuc bioluminescence prior to (pre) and at indicated time points post Dendra2 photoconversion of (d) whole tumor, and (e) photoconverted areas of the tumor (data are represented as mean ± SEM, n = 6 animals).

