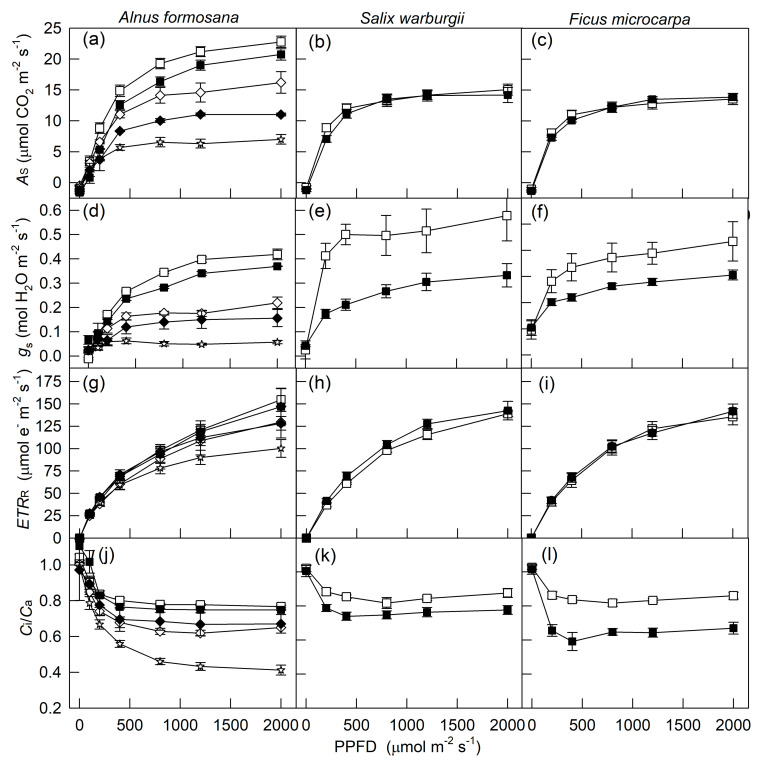
Figure 1.
Light-response curves of As (a–c), gs (d–f), ETRR (g–i), and Ci/Ca (j–l) for three tree species measured at 25 °C and 80% (open symbols) and 40% (closed symbols) relative humidity. AS and gs indicate the net photosynthetic rate and stomatal conductance, respectively, obtained from steady-state light response; ETRR indicates electron transport rate obtained from rapid light response; Ci and Ca indicate intercellular and atmospheric CO2 concentration, respectively, obtained from steady-state light response. Squares, diamonds, and stars gs indicate measured under well-watered conditions, mild and severe drought, respectively. Data are mean ± SE.

