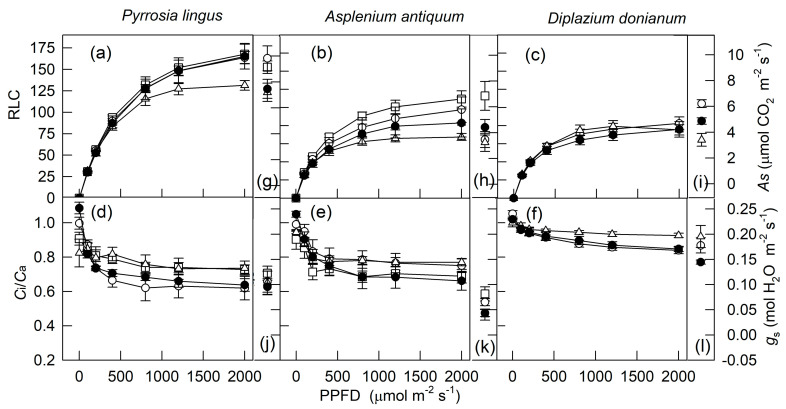
Figure 2.
Light-response curves for ETRR and Ci/Ca (a–f) as well as AS and gs measured at 2000 μmol m−2 s−1 photosynthetic photon flux (PPFD; g–l) for three fern species at 25 °C and 75% (open symbols, data from [3]) and 50% (closed symbols) relative humidity. AS and gs indicate the net photosynthetic rate and stomatal conductance, respectively, from steady-state light response; ETRR indicates electron transport rate from rapid light response; Ci and Ca indicate intercellular and atmospheric CO2 concentration, respectively. Squares, circles, and triangles indicate cultivated under 100%, 50%, and 10% sunlight, respectively. Data are mean ± SE.

