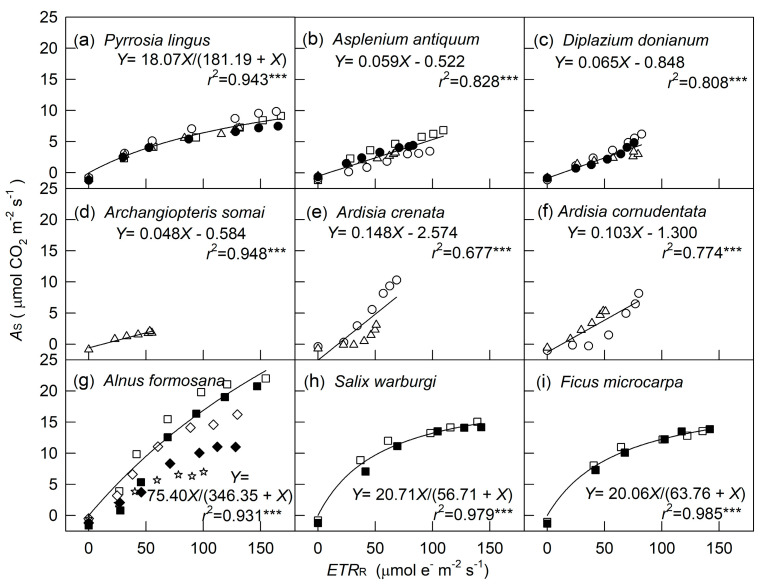
Figure 3.
Relationship between net photosynthetic rate from a steady-state light response (AS) and electron transport rates from a rapid light response (ETRR) for four ferns (a–d), two understory shrubs (e–f), and three tree (g–i) species. Squares, circles, and triangles indicate cultivated under 100%, 50%, and 10% sunlight, respectively, and measured under well-watered conditions; diamonds and stars (g) indicate cultivated under 100% sunlight and measured under mild and severe drought conditions, respectively. Open and closed symbols indicate measured under 75% and 50% relative humidity, respectively, for ferns and understory shrubs, and 80% and 40%, respectively, for trees. AS of ferns and understory shrubs measured at 75% relative humidity were from [3]. The regression line in g was fitted for well-watered conditions only. *** is significant at p < 0.001.

