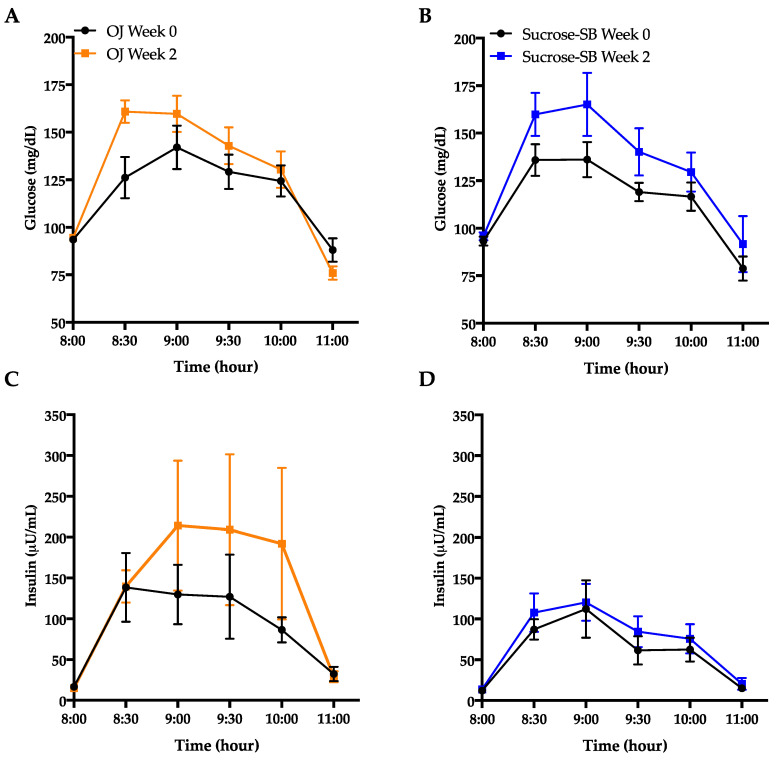
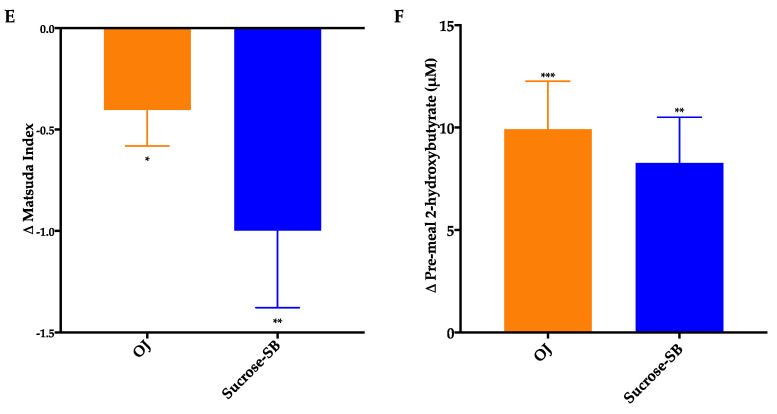
Figure 5.
Metrics of insulin sensitivity measured by oral glucose tolerance test (OGTT) and the metabolite, 2-hydroxybutyrate. Glucose curves during the OGTT before (black line) and after (blue line) consumption of either (A) OJ or (B) sucrose-SB for two weeks; Insulin curves during the OGTT before (black line) and after (blue line) consumption of either (C) OJ or (D) sucrose-SB for two weeks; (E) Changes in Matsuda Index; (F) 2-hydroxybutyrate concentrations measured after a 4-h fast. * p < 0.05, ** p < 0.01, *** p < 0.001 LS mean of change different from zero.


