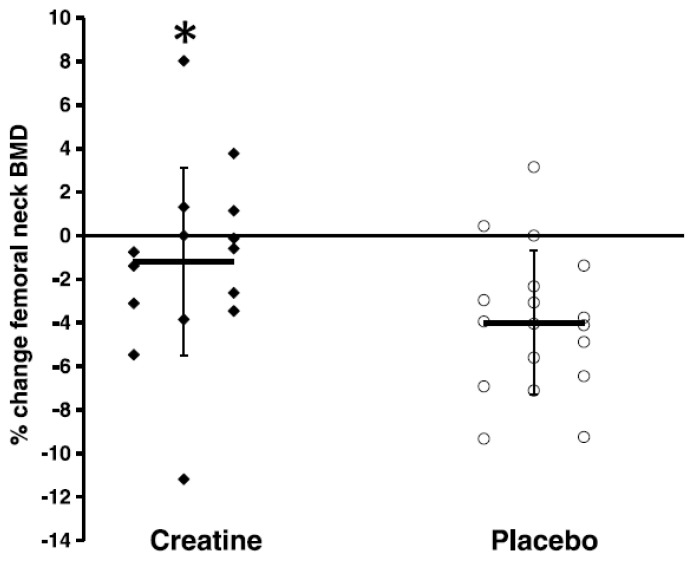
Figure 1.
Relative changes in femoral neck bone mineral density (BMD). “Closed diamonds” represent changes for individual creatine group participants, and “open circles” represent placebo group participants. The “horizontal bars” represent the group means, and the “vertical bars” represent the SD. * Creatine participants lost significantly less BMD at the femoral neck compared with placebo participants (p < 0.05). (Reproduced with permission from Chilibeck et al. 2015 [28]).

