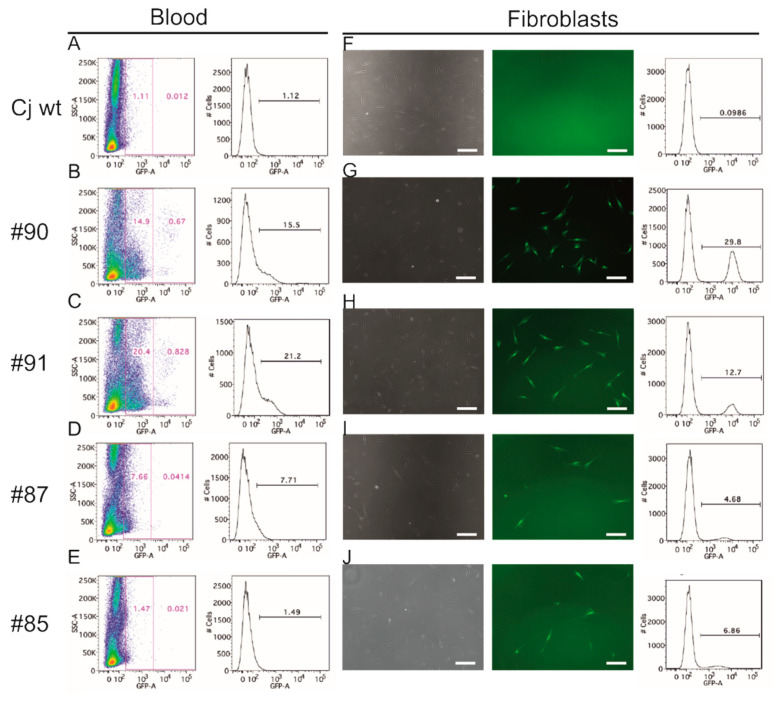
Figure 2.
Quantification of EGFP-positive cells by flow cytometry. (A–E) Peripheral blood cells. (A) Wt control. (B–E) EGFP-transgenic animals #90, #91, #87, and #85, respectively. The transgenic animals show between 1.5% and 21.2% EGFP-positive cells. (F–J) Cultured skin fibroblasts. Left column: bright-field images; middle column: fluorescence images; right column: flow-cytometric quantification of EGFP-positive fibroblasts. Scale bars: 100 µm. (F) Wt negative control. (G–J) EGFP-transgenic animals #90, #91, #87, and #85. The fibroblast cultures from the transgenic animals show between 4.7% and 29.8% EGFP-positive cells.

