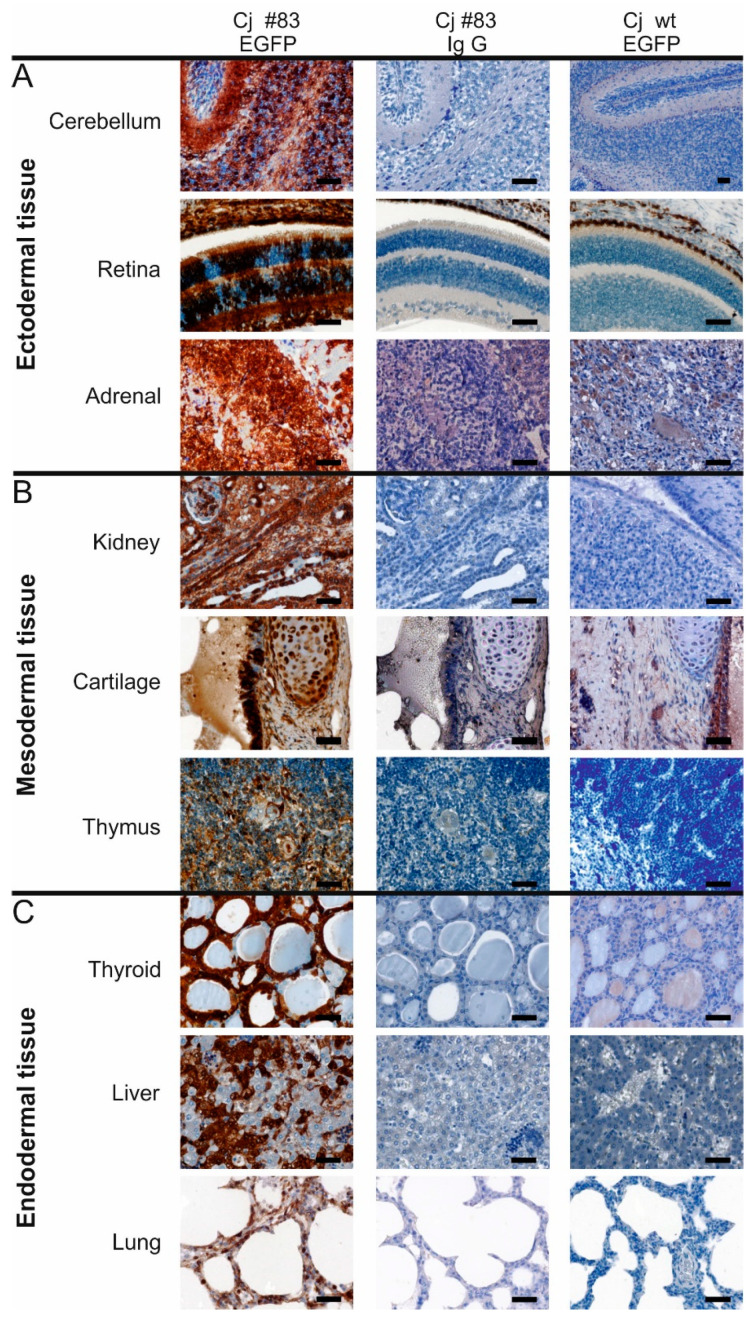
Figure 4.
EGFP expression analysis in tissues of #83. Left column: images of tissues from the EGFP-transgenic animal #83 incubated with the EGFP antibody. Middle column: consecutive sections of the same samples incubated with the IgG control serum. Right column: corresponding wt samples incubated with the EGFP antibody. (A) shows tissue samples of ectodermal, (B) of mesodermal and (C) of endodermal origin. Scale bars: 50 µm.

