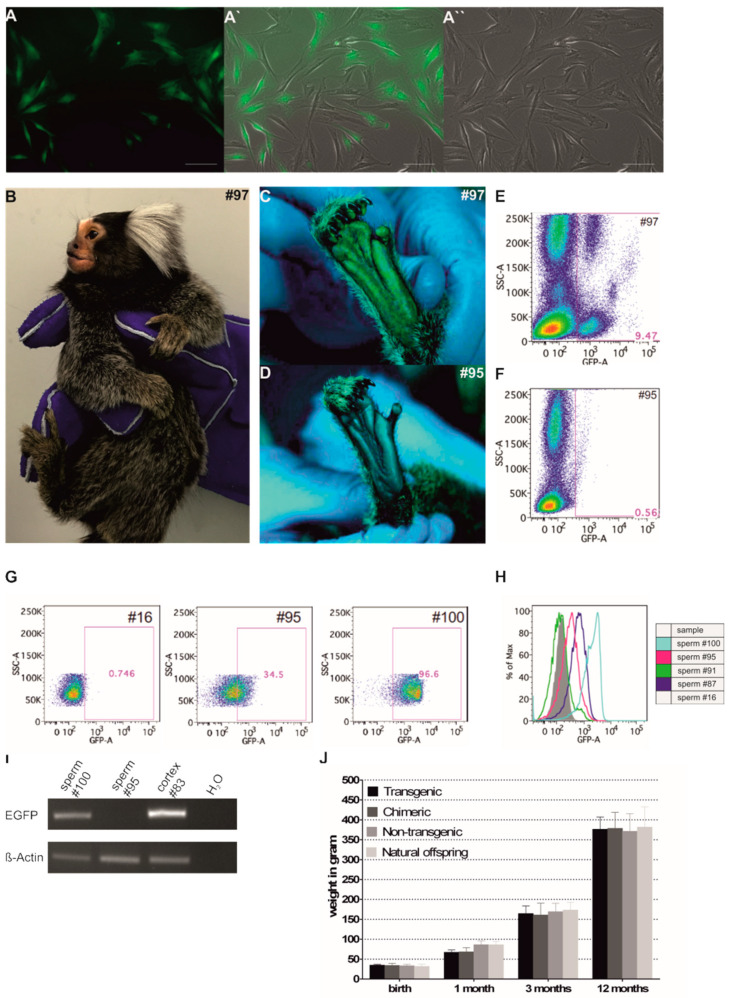
Figure 6.
Phenotyping of the F1 animals. (A) Cultured fibroblasts of animal #97 showing EGFP fluorescence. A: Fluorescence image, (A′): Merge with (A″) (right panel, bright-field image). Scale bars: 50 µm. (B) Whole body view of transgenic F1 animal #97. (C) Epifluorescent image of the foot pad of transgenic #97. (D) Epifluorescent image of the foot pad of chimeric #95, which showed no EGFP fluorescence. (E) Flow cytometry of nucleated peripheral blood cells of #97 and (F) #95. (G) Flow-cytometric analyses of sperm cells of #16 (wt control), #95 (F1 chimeric), and #100 (F1 transgenic). In animal #100 the whole cell population is homogenously shifted to higher fluorescence signals with 96.6% in the gate representing EGFP-positive cells. The analyses of spermatozoa shown in Figure 5C and Figure 6G were performed in one run and the analysis of wildtype animal #16 is shown as a control in both figures for the purpose of clarity. (H) Histogram overlay from flow-cytometric sperm cell analyses of transgenic founders #87 and #91 and F1 animals #95 and #100. The grey filled histogram represents wt sperm (#16). (I) PCR genotyping of ejaculated sperm from #95 and #100. (J) Postnatal gain of body weight in the different study groups.

