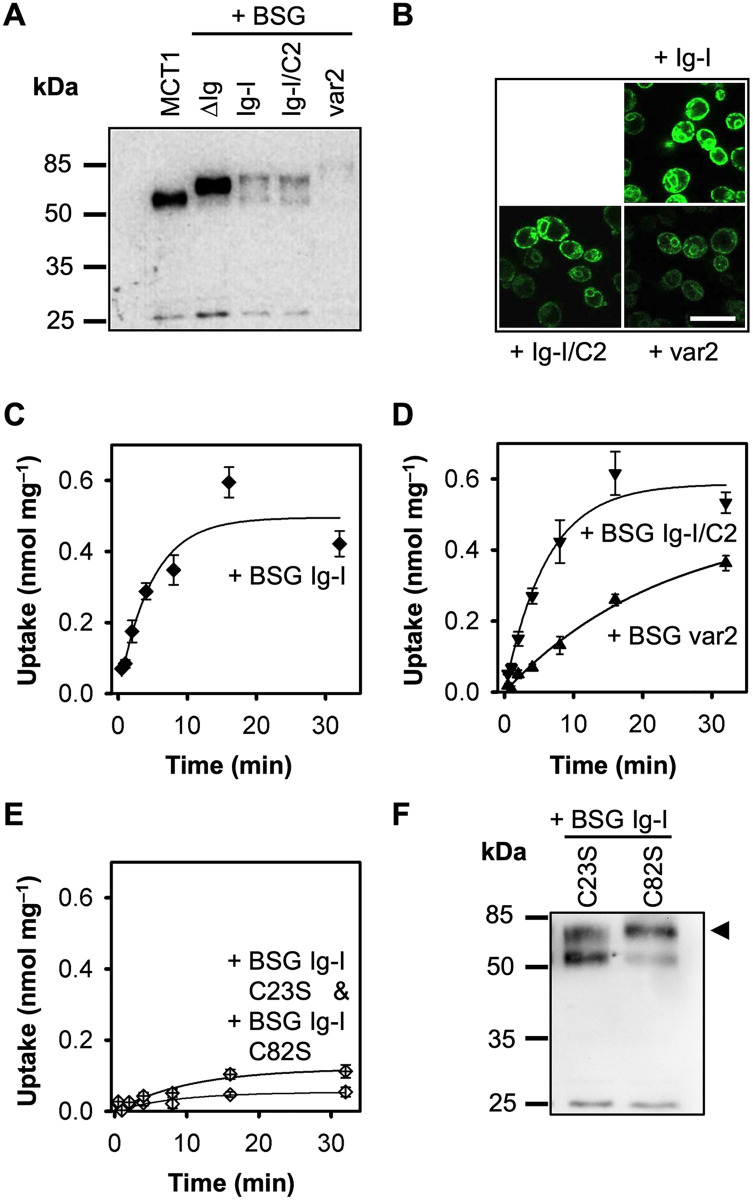
Fig 2. Increased uptake of l-lactate by MCT1 fusions with basigin variants carrying the extracellular Ig-I domain.
(A) Western blot showing expression of MCT1 alone (58 kDa) and fused with BSGΔIg (67 kDa), BSG Ig-I (77 kDa), BSG Ig-I/C2 (85 kDa), and BSG var2 (87 kDa) using a Penta-His antibody. (B) Visualization of the constructs at the plasma membrane via C-terminal GFP and live-cell confocal microscopy. (C–E) Uptake of 14C-labeled l-lactate via MCT1 fusion constructs with basigin variants at pH 6.8 and a 1 mM inward gradient. Shown are BSG Ig-I (C, ◆), BSG Ig-I/C2 (D, ▼), BSG var2 (D, ▲), and the BSG Ig-I point mutants C23S (E, ⟠) and C82S (E, ◊). The background of non-expressing cells was subtracted, and the data were normalized to 1 mg of cells; error bars represent ± S.E.M. of three biological replicates. (F) Western blot showing expression of MCT1 fused to BSG Ig-I C23S and C82S. The arrow head indicates the expected molecular weight of 77 kDa (Penta-His antibody).

