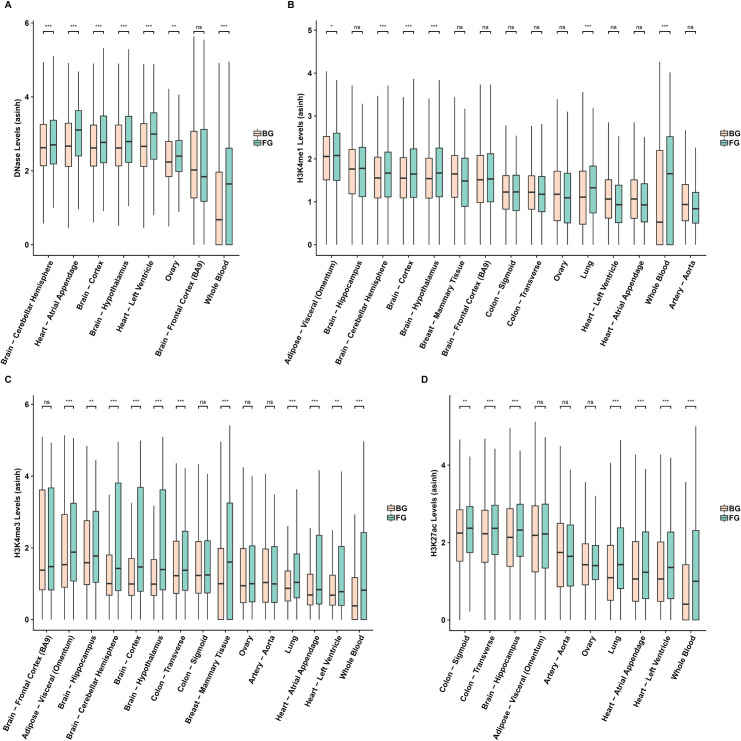
Fig 4. Detected SNPs are enriched for epigenomic markers of regulatory regions.
(A)-(D) Epigenomic signal comparison between the foreground and control SNPs for open chromatin (DNase), H3K4me1, H3K4me3, and H3k27ac respectively. The foreground is 200 bps windows around the detected SNPs (blue) and the control is 200bps windows around the control SNPs (red).

