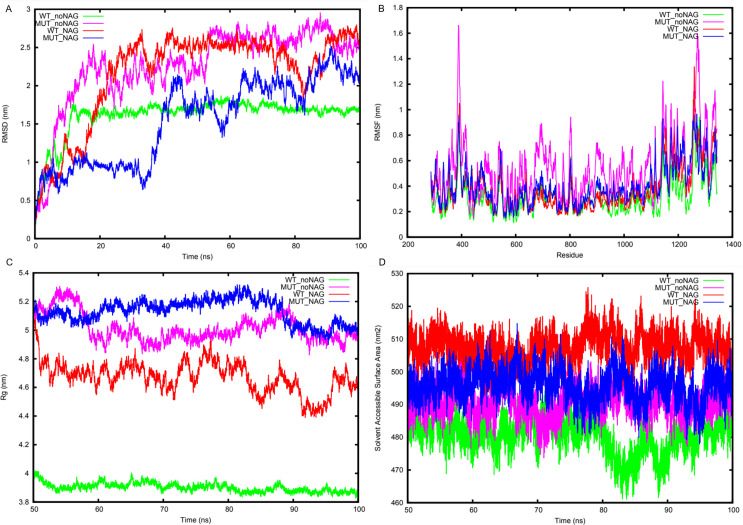
Fig 3. Trajectory analysis of wild type (WT) NRNX2 and mutant (MUT) NRNX2, both with and without NAG.
(A) root mean square deviation (RMSD) deviation of the backbone atoms. MEAN + STDEV (1.61mm ± 0.26, 2.26mm ± 0.52, 2.16mm ± 0.60 and 1.54mm ± 0.55). (B) The average RMSF fluctuation per-residue. MEAN + STDEV (0.31mm ± 0.14, 0.54mm ± 0.24, 0.37mm ± 0.18 and 0.40mm ± 0.19). (C) Radius of gyration of the backbone atoms. MEAN + STDEV (3.90mm ± 0.03, 5.01mm ± 0.10, 4.67mm ± 0.11 and 5.13mm ± 0.08). (D) Solvent accessible surface area of the protein. MEAN + STDEV (3.90mm ± 0.03, 5.01mm ± 0.10, 4.67mm ± 0.11 and 5.13mm ± 0.08). Line colors: WT_noNAG = green, MUT_noNAG = light magenta, WT_NAG = red and MUT_NAG = blue.

