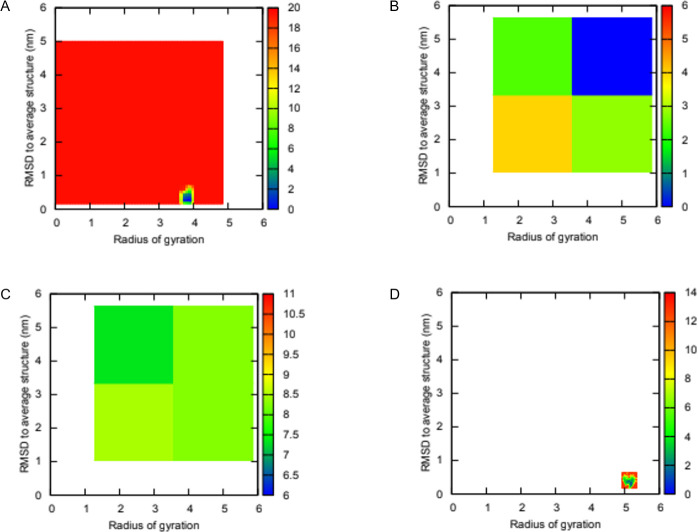
Fig 5. Two-dimensional (2D) free energy landscapes plotted for NRXN2 along two order parameters root mean square deviation (RMSD) to average structure and Rg.
(A) WT without NAG (B) MUT without NAG (C) WT with NAG (D) MUT with NAG. Blue regions represent low energy conformational states while red indicate high energy states.

