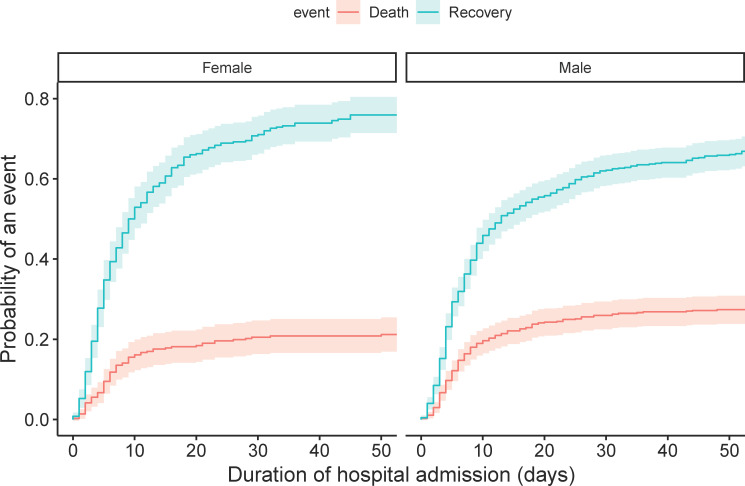
Fig 3. Cumulative incidence plot of death and recovery in the total population, separated by sex.
Gray’s test indicated a statistically significant difference between both groups for recovery (p = 0.003), but not for death (p = 0.050). The probability of death for females after one, two and three weeks of hospital admission was 12.5% (95% CI 10.0–17.1), 17.6% (95% CI 13.7–21.6), and 19.1% (95% CI 15.0–23.2), respectively, whereas for males the probability of death was 16.4% (95% CI 13.5–19.3), 22.1% (95% CI 18.9–25.4), and 24.3% (95% CI 20.9–27.6), respectively.

