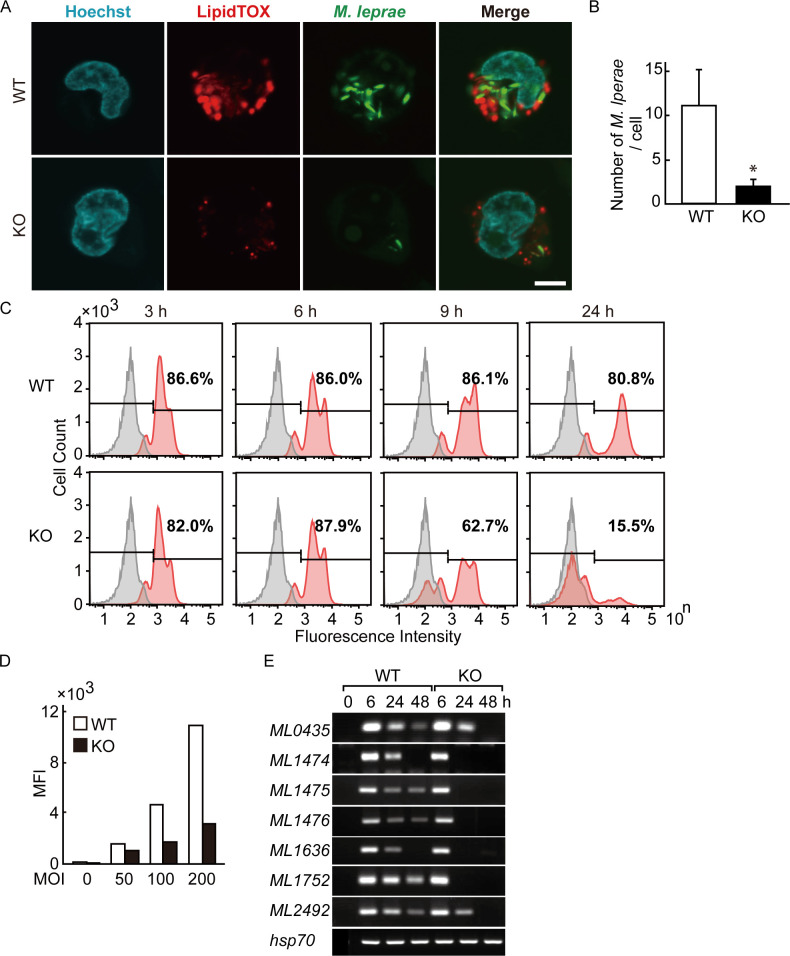
Fig 4. Intracellular M. leprae viability requires GPAT3.
(A) Wild-type (WT) and GPAT3 KO THP-1 cells infected with FITC-conjugated M. leprae (MOI: 200) were cultured for 24 h and confocal laser scanning microscopy was used to analyze M. leprae and lipid droplet localization. Fluorescence images of lipid droplets stained with LipidTOX (red), M. leprae (green), Hoechst 33258 (blue) and their merged images are shown. Scale bar: 5 μm. (B) Quantification of M. leprae in WT and GPAT3 KO cells (n = 30 each) shown by the mean ± S.D. Significance was determined with a Student’s t test. One asterisk indicates p<0.01. (C) WT and GPAT3 KO THP-1 cells were infected with FITC-conjugated M. leprae (MOI: 200) for 3, 6, 9, and 24 h, and the fluorescence intensity of 100,000 cells was analyzed by flow cytometry. Gray and red peaks indicate the fluorescence intensity of uninfected and infected cells, respectively. (D) Mean fluorescence intensity (MFI) of cells infected with different MOI (0, 50, 100, and 200). (E) Wild-type and GPAT3 KO cells (3 × 10⁶) were cultured in 6-well plates and inoculated with M. leprae. After incubation for the indicated period of time, total RNA was purified and an RT-PCR analysis for M. leprae pseudogenes were performed. A representative result from three independent experiments is shown in each panel.

