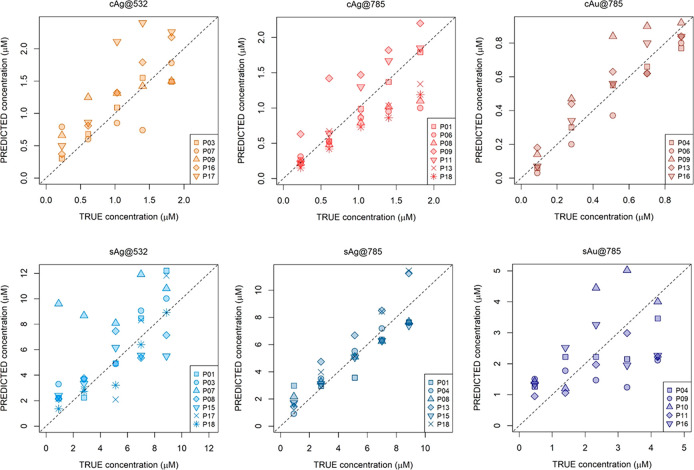
Figure 6.
Plot of estimated values against the actual values for the test set samples for different methods by different participants (P01–P18). The dotted line is the line of equality. For a complete representation of the uncertainty of each individual prediction, see Figures S4–S9 in the Supporting Information.

