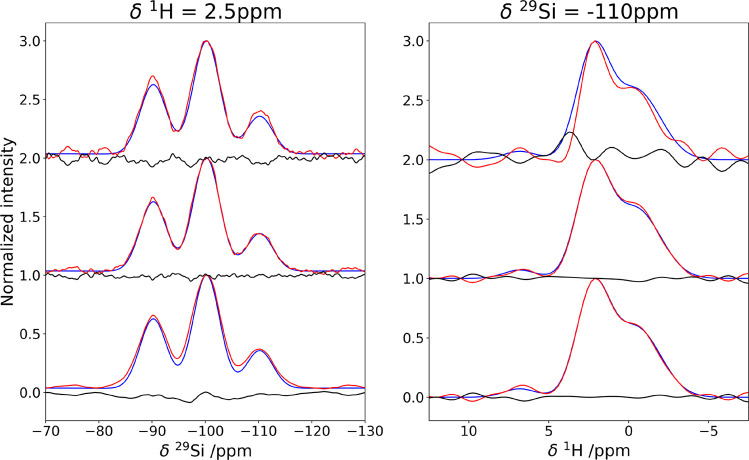
Figure 2.
Impact of the coprocessing in the denoising of the synthetic spectrum B. In all panels, the blue trace corresponds to the noiseless spectrum. The denoising steps are listed from top to bottom: (top) initial spectrum-red trace and difference-black trace, (middle) MCR-reconstructed spectrum-red trace and difference-black trace, (bottom) MCR+Cadzow reconstructed spectrum-red trace and difference-black trace.

