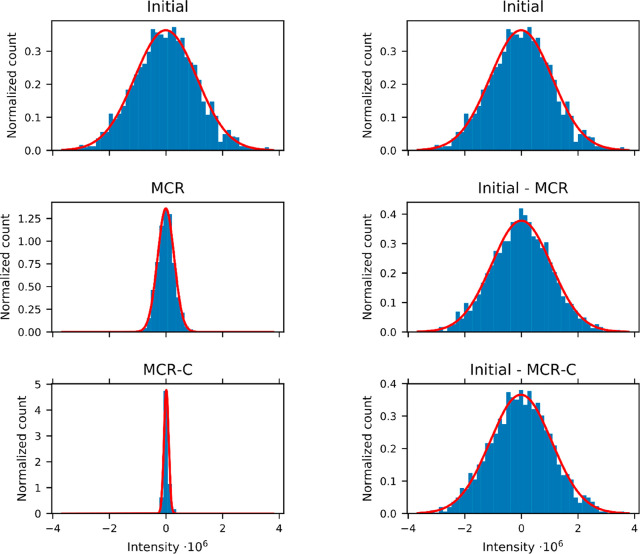
Figure 4.
Distribution of the intensities along the points of the row of the spectrum extracted at 50 ppm, which contains only noise, representing the noise in the initial spectrum (initial) and after application of combined denoising. Left–intensity in the “signal” spectrum CST; Right–intensity in the “noise” spectrum E. The red curves are the best fitting Gaussian distributions that approximates the intensities, their parameters are given in SI Table S3.

