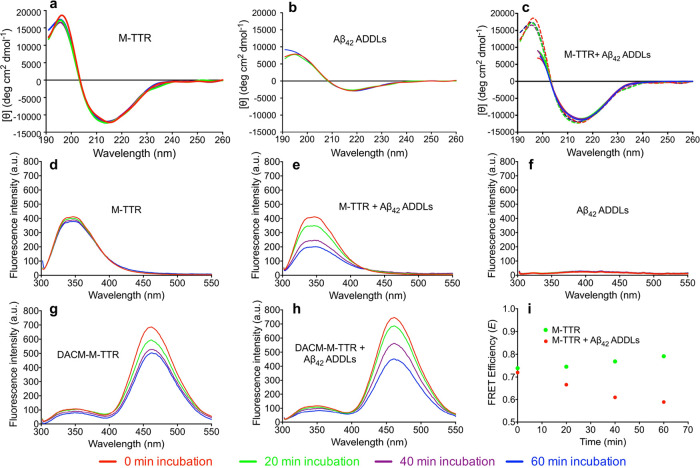
Figure 6.
M-TTR undergoes a specific conformational change, while maintaining the topology, upon binding to Aβ42 ADDLs. (a–c) Far-UV CD spectra of M-TTR (a), Aβ42 ADDLs (b), and M-TTR plus Aβ42 ADDLs (c) measured at the indicated times of incubation using a protein concentration of 0.1 mg mL–1 (a, b) or 0.2 mg mL–1 with a 1:1 mass ratio of M-TTR: Aβ42 ADDLs (c). In panel (c), the experimental spectra (continuous lines) are compared with those obtained by summing the spectra of M-TTR alone and ADDLs alone (dashed lines). (d–h) Fluorescence spectra recorded for both M-TTR (d, e) and DACM-M-TTR (g, h) in the absence (d, g) and presence (e, h) of Aβ42 ADDLs after the indicated times of incubation. Fluorescence spectra recorded for Aβ42 ADDLs alone are also shown (f). (i) FRET E values of M-TTR in the absence (green) and presence (red) of Aβ42 ADDLs.

