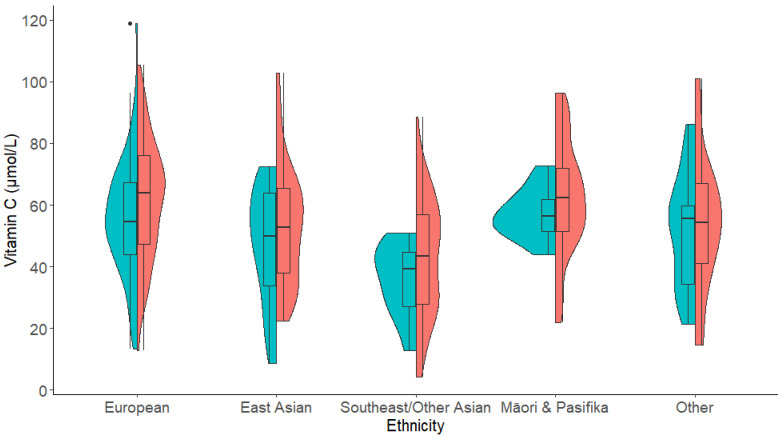
Figure 2.
Violin plot showing the vitamin C levels for each ethnicity by gender (male = blue (left) and female = red (right)). Overlaid boxplots show median vitamin C levels for each gender for each ethnicity, interquartile range, and any outliers. See Supplementary Table S2 for the mean plasma vitamin C levels for each ethnicity by gender subgroup. Europeans (n = 206, 80 male, 126 female), East Asians (n = 68, 17 male, 51 female), Southeast/Other Asian (n = 61, 9 male, 52 female), Māori & Pasifika (n = 38, 10 male, 28 female), other ethnicities (n = 46, 19 male, 27 female).

