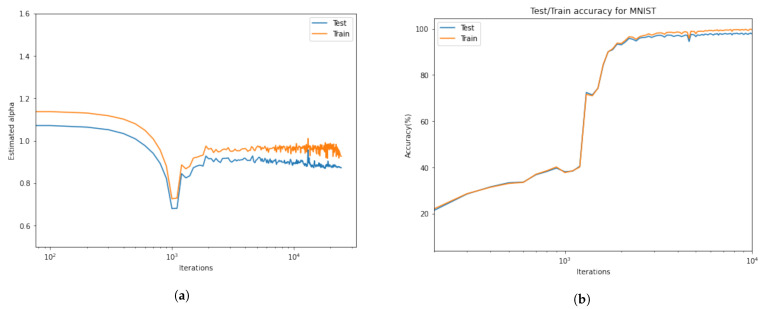
Figure 6.
(a) The behavior of tail-index α during the iterations; (b) The training and testing accuracy. At first, the α decreases very slowly; when α reaches its lowest level, which means longer tail distribution, there is a significant jump, which causes a sudden decrease in accuracy. Beyond this point, the process recovers again, and we see stationary behavior in α and an increasing behavior in the accuracy.

