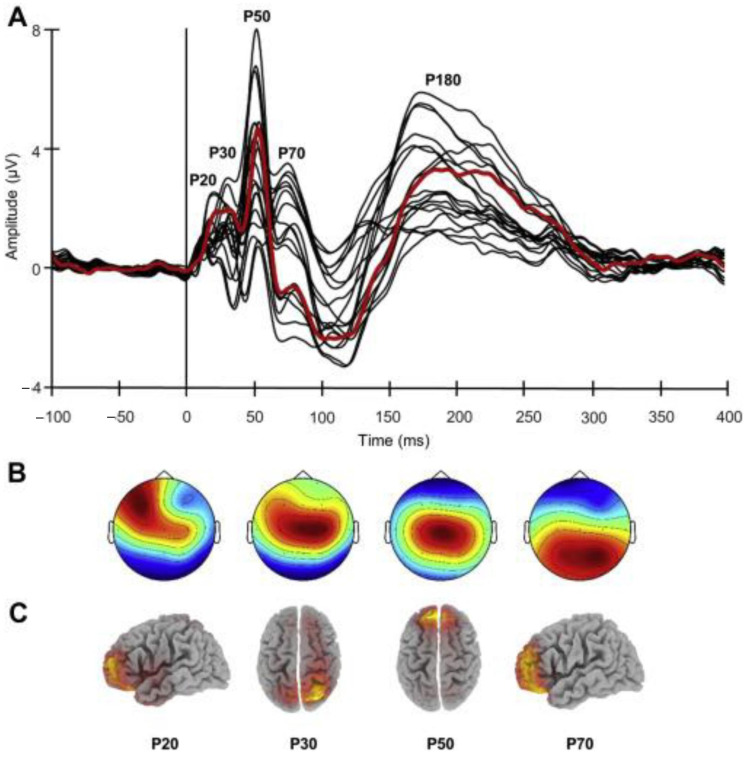
Figure 4.
TMS–EEG results. (A) Butterfly plot of the grand-averaged TMS-evoked potentials (TEP) from all the electrodes showing the main components elicited by left dorsolateral prefrontal cortex stimulation. The signal from the target site of stimulation (electrode F3) is depicted by the red line. (B) Topographic distribution. (C) sLORETA source localization for each TEP component before 100 ms. (For interpretation of the references to color in this figure legend, the reader is referred to the Web version of this article). Reproduced with permission from Bagattini et al., 2019 [34].

