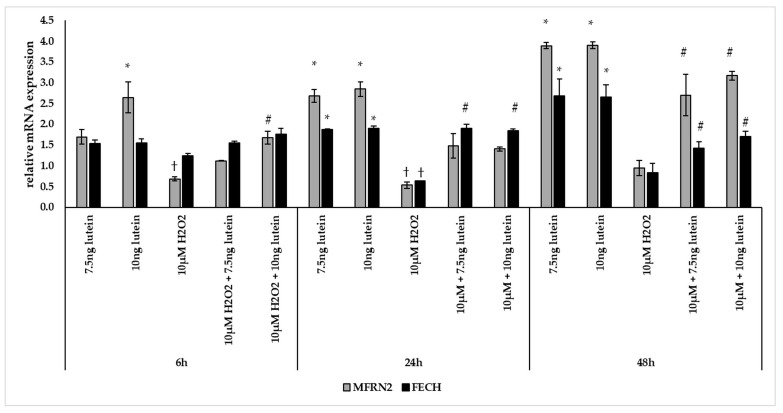
Figure 8.
Effects of lutein and H2O2 treatment on mRNA expressions of MFRN2 and FECH. The columns represent the mean values, and error bars indicate the standard deviation (SD) of three independent experiments (n = 3), each performed in triplicate, and are presented relative to own control cells. * indicates statistical significance of lutein treatments versus controls; † indicates statistical significance of H2O2-treated cells compared to controls; # indicates statistical significance of combined (lutein with H2O2) treatments compared to H2O2 treatments; the level of significance was p < 0.05. Real-time PCR was performed with the SYBR green protocol using gene-specific primers. β-actin was used as house-keeping gene for the normalization. The relative expression of controls was regarded as 1.

