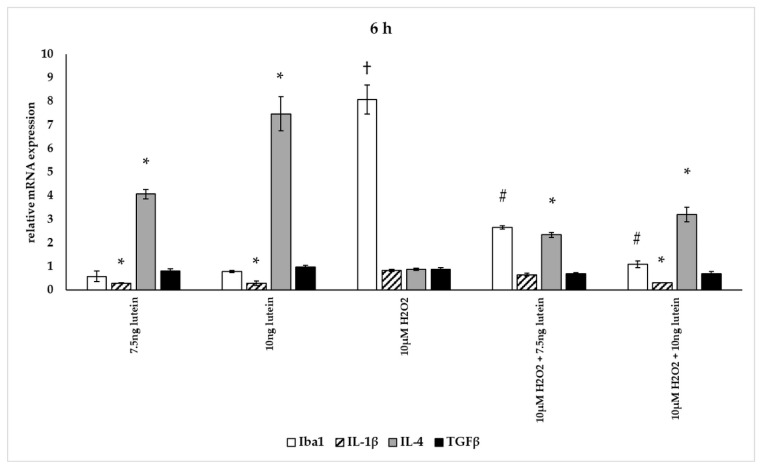
Figure 12.
Effects of lutein and H2O2 on Iba1, IL-1β, IL-4 and TGFβ mRNA expression at 6 h. The columns represent the mean values, and error bars indicate the standard deviation (SD) of three independent experiments (n = 3), each performed in triplicate, and are presented relative to own control cells. * indicates statistical significance of lutein treatments versus controls; † indicates statistical significance of H2O2-treated cells compared to controls; # indicates statistical significance of combined (lutein with H2O2) treatments compared to H2O2 treatments; the level of significance was p < 0.05. Real-time PCR was performed with the SYBR green protocol using gene-specific primers. β-actin was used as house-keeping gene for the normalization. The relative expression of controls was regarded as 1.

